tradingview keltner channel

What is the Keltner Channel on TradingView? A Complete Guide

Are you looking for a reliable indicator that can help you identify price trends, volatility levels, and potential trading opportunities? If so, you might want to check out the Keltner Channel on TradingView. The Keltner Channel is a banded indicator that shows you the range of price movement around a moving average. It can help…

tradingviewrectangle

How to Draw a Rectangle on TradingView: A Step-by-Step Guide

TradingView is one of the most popular platforms for traders and investors who want to analyze and trade the financial markets. It offers a variety of tools and features that make it easy to create and customize charts, indicators, strategies, and more. One of the tools that you can use on TradingView charts is the…

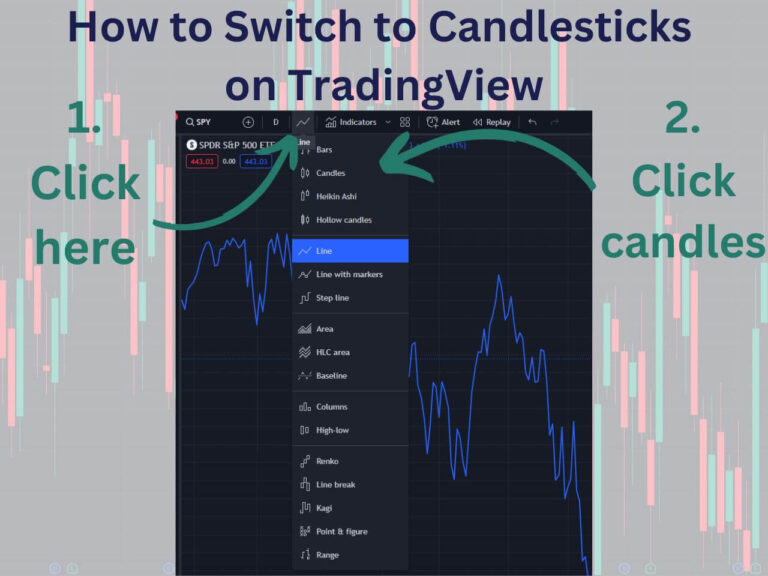
how to get candlesticks on tradingview

How to Get Candlesticks on TradingView: A Comprehensive Guide

Candlestick patterns are powerful tools for traders and investors looking to analyze price movements and make informed trading decisions. However, there are times when you may find that candlesticks have disappeared from your TradingView chart. In this article, we’ll explore what candlestick patterns are, how to get them on TradingView, and how to unhide them…

tradingviewremoveindicators

TradingView | How to Remove Indicators From Your Chart

TradingView offers an array of tools and indicators designed to facilitate your trading experience. However, understanding how to manage these indicators is key to an organized and efficient trading experience. Here’s a step-by-step guide on how to remove and manage indicators in TradingView. How to Remove Indicators From a TradingView Chart Removing indicators in TradingView…

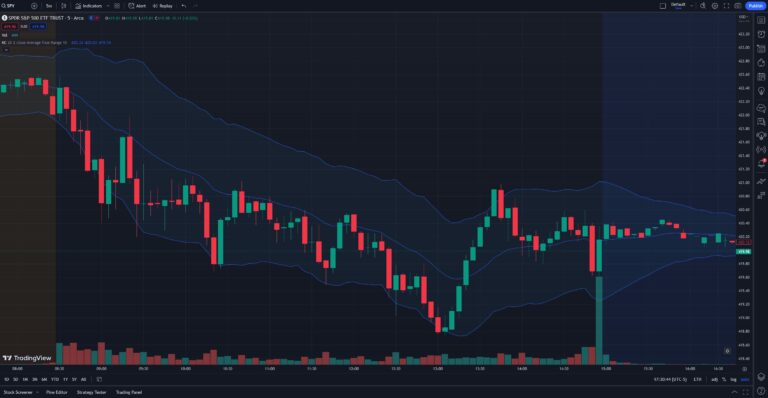
tradingview add volume

How to Add Volume in TradingView Chart: A Simple Guide

By default, TradingView does not show the volume bars at the bottom of the chart. This article will walk you through how to add and utilize the volume indicator in your TradingView charts. How to Add Volume to Your TradingView Chart Adding the volume indicator on TradingView is straightforward. Follow these steps: You can also…

tradingviewimpliedvolfeatured

How to View Implied Volatility and IV Rank/Percentile on TradingView

Implied volatility plays a crucial role in options trading, providing insights into the market’s expectations for future price movements. This article will explore how to view and interpret implied volatility on TradingView. Understanding Implied Volatility (IV) Implied volatility represents the market’s perception of the magnitude of potential price changes in an underlying asset. A stock’s…

market profile on tradingview
|

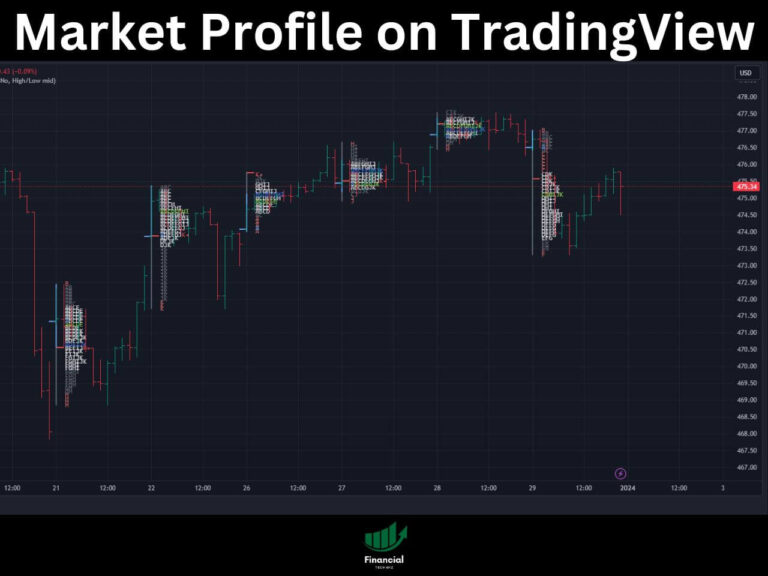
TradingView TPO Charts Explained (TradingView Market Profile)

The market profile is an advanced indicator that displays a combination of time spent and volume traded at each price level. It is generally only applicable to day traders, but it can also be used to determine optimal entry and exit points for swing trading.  In this comprehensive guide, we’ll explore the the history, concepts,…