VOO vs. QQQ: Which ETF is Right for You?
When it comes to Exchange Traded Funds (ETFs), investors often find themselves comparing different options to determine the best fit for their portfolio. In this article, we’ll compare VOO vs. QQQ to help you make an informed decision.
Key Metrics Comparison
Before we delve into the specifics of VOO and QQQ, let’s first look at the key metrics that differentiate these ETFs:
- Expense Ratio: VOO boasts an expense ratio of 0.03%, while QQQ has an expense ratio of 0.20%.
- Dividend Yield: VOO offers a dividend yield of 1.6%, whereas QQQ provides a dividend yield of 0.59%.
Now that we have an overview of the metrics let’s explore each ETF in more detail.
VOO: S&P 500 ETF
VOO seeks to replicate the returns of the S&P 500 Index, which comprises 500 of the most valuable public companies in the USA. It is widely regarded as a gauge of the overall U.S. economy. Some key points about VOO include:
- Broad Exposure: By investing in VOO, you gain exposure to a diverse range of valuable U.S. companies across various sectors.
- Low Expense Ratio: VOO boasts a low expense ratio, which makes it an attractive option for investors looking for cost-effective exposure.
- Stability in Crisis: VOO has demonstrated its resilience during times of economic downturn, making it a reliable choice for conservative investors.
QQQ: Nasdaq 100 ETF
QQQ, on the other hand, tracks the Nasdaq 100 Index, which is heavily weighted toward the technology sector. Here are some important factors to consider about QQQ:
- Concentrated Tech Exposure: QQQ provides investors with concentrated exposure to innovative and technology-focused companies, including giants like Apple, Amazon, Microsoft, Facebook, and Google.
- Potential for Aggressive Growth: Due to its focus on the tech sector, QQQ has the potential for aggressive growth and has historically outperformed the broader market.
- Higher Expense Ratio: QQQ’s expense ratio is slightly higher compared to VOO, which is an aspect to consider when evaluating the cost of investing in this ETF.
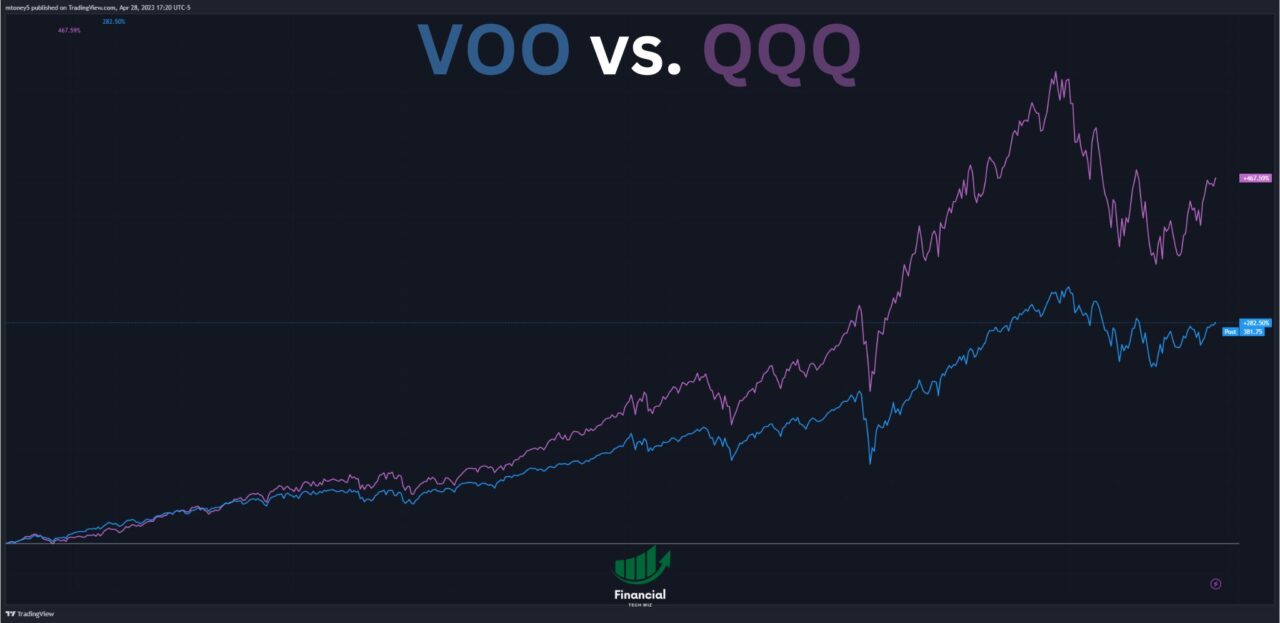
Total Return Comparison
To better understand the performance of VOO and QQQ, let’s take a look at the total return comparison since June 2012. As depicted in the TradingView chart below, VOO has delivered a total return of 282%, while QQQ has outperformed with a total return of 467%.
Performance and Cost Analysis
The total return is a crucial performance metric to consider when evaluating ETFs. However, it’s important to keep in mind that investment decisions should not be solely based on past performance. Other factors, such as expense ratio and dividend yield, play a significant role in the overall performance and cost of the ETFs.
Comparing ETFs With TradingView
When comparing ETFs, it is crucial that you are comparing the total return to include dividend payments. TradingView allows you to compare several stocks and ETFs at once on a single chart adjusted for dividends.
You can simply sign up for a free TradingView account and type the stock ticker you want to compare. Next, click the plus sign next to the ticker at the top left of the chart to add symbols to compare.
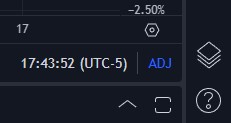
Finally, ensure you click the ‘ADJ’ at the bottom to adjust the returns for dividends!
As you can see in the TradingView chart below, you can compare multiple funds and ETFs on a single chart, making your research much easier. Feel free to compare any ETFs you’d like using the widget.
Explore Other ETF Comparisons
To further expand your knowledge on ETF comparisons, here are some related articles you might find useful:
- QQQ vs. VTI: A comparison of QQQ and VTI ETFs.
- VOO vs. SCHD: Analyzing the similarities and differences between VOO and SCHD ETFs.
- JEPI vs. SCHD: A comprehensive comparison of JEPI and SCHD ETFs.
- JEPI vs. JEPQ: Exploring the distinctions between JEPI and JEPQ ETFs.
- QYLD vs. JEPI: A detailed analysis of QYLD and JEPI ETFs.
- VOO vs. SPY: See which S&P 500 fund is best for you.
Feel free to explore these articles to gain deeper insights into different ETF comparisons.
The Financial Tech Wiz ETF Comparison Tool
You can use the ETF comparison tool below to compare over 2,000 ETFs and mutual funds with data I manually collected:
Bottom Line | VOO vs. QQQ
VOO and QQQ are two popular ETFs with distinct characteristics. VOO provides exposure to the S&P 500, while QQQ concentrates on the tech sector. When considering the total return comparison, QQQ has outperformed VOO since June 2012.
However, it's essential to evaluate other factors like expense ratio and dividend yield in addition to the total return. Consider your investment goals, risk tolerance, and personal preferences when choosing between VOO and QQQ.
Before you go
If you want to keep educating yourself about personal finance, you must check out these posts as well:
What is the Most Successful Options Strategy
Options Trading for Income: The Complete Guide
Mark Minervini's Trading Strategy: 8 Key Takeaways
The Best Options Trading Books
The Best Laptops and Computers for Trading
How to Get a TradingView Free Trial
The Best TradingView Indicators
This article contains affiliate links I may be compensated for if you click them.
– Free trading journal template & cheat sheet PDFs
– Access our custom scanners and watchlists
– Access our free trading course and community!


