TrendSpider vs TradingView – Which Charting Software is Best?
TradingView and TrendSpider are some of the most popular stock charting software, but they have some differences, which we will explore in this article.
Key Differences of TradingView and TrendSpider
- TradingView runs on a freemium model, which means you can use most features for free, while TrendSpider does not offer a free option.
- TrendSpider is a bit more expensive, but it offers better customer support and more charts per layout.
- TrendSpider includes real-time data in the pricing, while TradingView allows you to buy it directly from the exchanges.
- TradingView offers real-time data for most assets for free whenever they can.
TradingView
- Starting price: $12.95 per month billed annually
- Ability to use the platform for free
- Over 1,000 built-in indicators
- Advanced indicators like footprint charts, TPO charts, and volume profile
- Up to 16 charts per layout with a professional plan
- Advanced screeners, heatmaps, calendars, backtesting, and other tools
TrendSpider
- Starting price: $107 per month (save 25% with my discount link)
- Real-time data included in the premium price
- An AI assistant that can perform actions based on anything you type
- Up to 16 charts per layout
- AI-powered screeners, backtesting, fundamental data, and more
Overview of TradingView
TradingView is one of the most widely used platforms for charting, screening, and trading the financial markets. It supports a wide range of markets and data sources, including international stocks, bonds, forex, crypto, and futures.
You can access TradingView from any web browser or mobile device, as well as integrate it with popular brokers such as Oanda, Interactive Brokers, TradeStation, and more.
Some of the main features and benefits of TradingView are:
- A powerful and user-friendly screener that allows you to filter by technical and fundamental criteria, such as price, volume, indicators, earnings, dividends, ratings, and more.
- A large library of indicators and drawing tools, as well as the ability to create custom indicators using Pine Script, a proprietary coding language that is easy to learn and use.
- A direct broker integration that enables you to trade from the platform without switching to another application or website. You can also use paper trading to practice your strategies without risking real money.
- A social network that enables you to share your ideas, learn from experts, and access live streams and trade signals. You can also join chat rooms, follow other traders, comment on charts, and participate in contests.
If you want to try TradingView risk-free, you can sign up for a TradingView free trial to test out all of the premium features at no cost! When you use my affiliate link to register, you will also get a discount on your subscription. You can also read my full review of TradingView to learn more.
Exclusive Deal: 30-Day FREE Premium Access + Bonus Credit
Don’t Miss Out – Sign up for TradingView Now!
- Advanced Charts
- Real-Time Data
- Track all Markets
Overview of TrendSpider
TrendSpider is a great alternative to TradingView for those who want a more advanced platform with automated technical analysis tools and more charts per layout.
TrendSpider is a relatively new platform that aims to automate technical analysis and make it easier and faster for traders. It uses artificial intelligence and machine learning to draw trendlines, chart patterns, Fibonacci retracements, candlestick patterns, and more. It also allows you to create custom strategies and backtest them with historical data.
Some of the main features and benefits of TrendSpider are:
- An advanced automated chart pattern recognition that draws trendlines, chart patterns, Fibonacci retracements, candlestick patterns, and more. You can also adjust the sensitivity and accuracy of the automation according to your preferences.
- A no-code custom strategy builder and backtester that allows you to test different scenarios and optimize your trading performance. You can use predefined templates or create your own based on custom parameters.
- A comprehensive technical screener that incorporates pattern recognition and multiple timeframes. You can scan for stocks that match your criteria across different timeframes simultaneously.
- An alternative data integration that provides insights from social media sentiment, analyst estimates, dark pool volume, short volume, and more. You can use these data sources to complement your technical analysis and find hidden opportunities.
- Proprietary raindrop charts
If you want to try TrendSpider out, you can get 25% off your subscription using my affiliate link and the code: FTW25! You can also read my full review of TrendSpider for more information.
TrendSpider Special Offer!
Exclusive Deal: 25% Discount with Code FTW25
Elevate Your Trading – Join TrendSpider Today!
- AI-Powered Analysis
- Automated Technical Analysis
- 16 charts per layout
Factors to Consider Between TradingView & TrendSpider
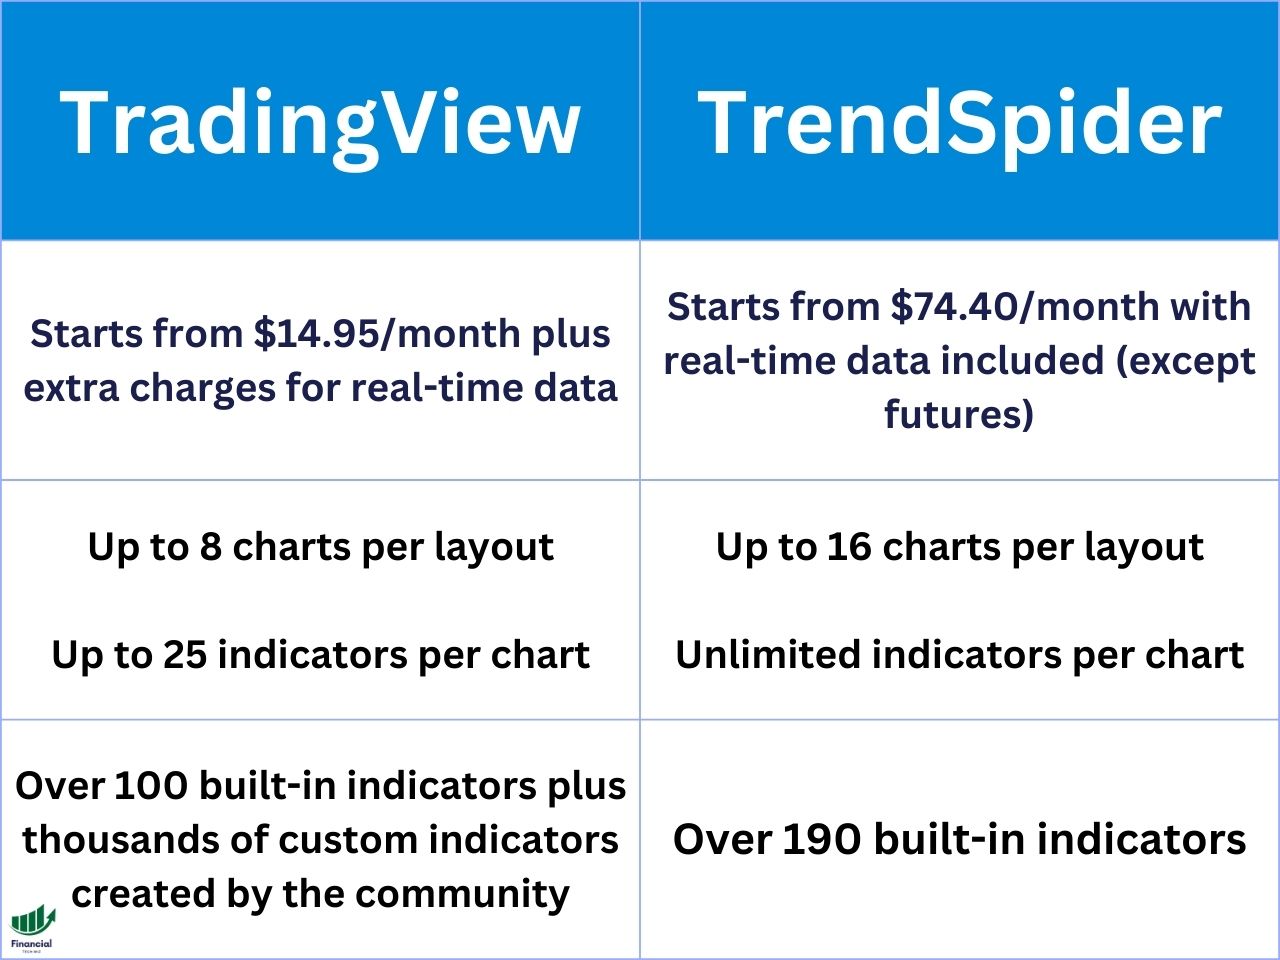
Both TradingView and TrendSpider offer excellent features and benefits for traders of all levels and styles. However, there are some differences between them that you should consider before choosing one over the other. Here is a table comparing some key features of TradingView and TrendSpider:
TradingView vs. TrendSpider Indicator Selection
Both TrendSpider and TradingView offer tons of indicators, but there are some subtle differences. Overall, TradingView provides a better indicator selection since it offers footprint and TPO charts, along with the volume profile. On the other hand, TrendSpider offers volume by price but not advanced chart types like TPO or footprint.
Volume Profile & Volume by Price
The volume profile and volume by price are essentially the same indicators, but there are some differences when it comes to using them on each platform. TrendSpider’s volume by price indicator is best for swing traders as you can’t use a session volume profile.

On the other hand, TradingView offers a session volume profile and a visible range volume profile. The visible range volume profile on TradingView is just like the volume by price on TrendSpider. However, TrendSpider doesn’t offer a session volume by price, which would be useful mostly for day traders.

Custom Indicators
TradingView also wins when it comes to community made custom indicators. TradingView has its own coding language called Pine Script which can be used to create custom indicators. You can access all of the public custom indicators on TradingView in the same way you add indicators to your chart normally.
TrendSpider does not offer a similar feature, but the team is responsive and is consistently adding new features to the platform.
TrendSpider vs. TradingView Automated Analysis Tools
When it comes to automated analysis tools, TrendSpider wins since it offers automated trendlines, chart pattern recognition, candle pattern recognition, and an AI assistant.
TradingView also offers auto trendlines, chart patterns, and candle pattern recognition, but it does not have an AI assistant.
TrendSpider’s AI assistant allows you to easily perform any action by just typing a prompt. For example, you can type “add the RSI indicator” to the assistant, and it will automatically add the RSI indicator to your chart. This makes performing any action on the TrendSpider platform incredibly easy.
TradingView vs. TrendSpider Mobile Apps
Both platforms offer mobile apps, but TrendSpider’s app is only available to iOS users. Both apps allow you to chart stocks on the go but do not include some of the features available on a computer.
For example, the TradingView mobile app doesn’t allow you to use the strategy tester or Pine Script editor. Overall, both platforms offer solid apps, and they are both great for quick analysis if you are not at your trading laptop or computer.
TrendSpider vs. TradingView Pricing
When it comes to pricing, TradingView is the clear winner due to its freemium model. You can use most of the TradingView features for free, while TrendSpider does not offer any sort of free plan. TradingView even offers real-time data for free whenever possible. Here is a breakdown of the pricing for each platform:
TrendSpider Pricing
TrendSpider generally costs $107-$447 per month without a sale or discount code. However, they usually offer sales, and you can get an additional 25% off when you use my affiliate link and coupon code, FTW25, at checkout.
TradingView Pricing
TradingView plans range from $0-$60 per month, depending on which plan you choose. You can also get a free trial and a referral credit when you sign up using my affiliate link.
Backtesting
Backtesting is the process of testing your trading strategies with historical data to evaluate their performance and profitability. Both TradingView and TrendSpider allow you to create and backtest your own trading strategies with custom parameters.
TradingView Backtesting
TradingView allows you to manually backtest your strategies by applying them to the chart and seeing how they would have performed in the past.
You can also write your own trading strategies using Pine Script, which gives you more flexibility and control over your logic and rules.
You can then use TradingView’s strategy tester to analyze the results of your backtesting, such as net profit, drawdown, win rate, and more.
TrendSpider Backtesting
TrendSpider allows you to create your own trading strategies without coding using its no-code custom strategy builder. You can use predefined templates or create your own based on custom parameters, such as indicators, patterns, timeframes, and more.
You can then use TrendSpider’s automated backtester to test your strategies with historical data and see how they would have performed in the past. The backtester allows you to compare different strategies and optimize them based on various metrics, such as net profit, drawdown, win rate, and more.
Multiple Chart Abilities
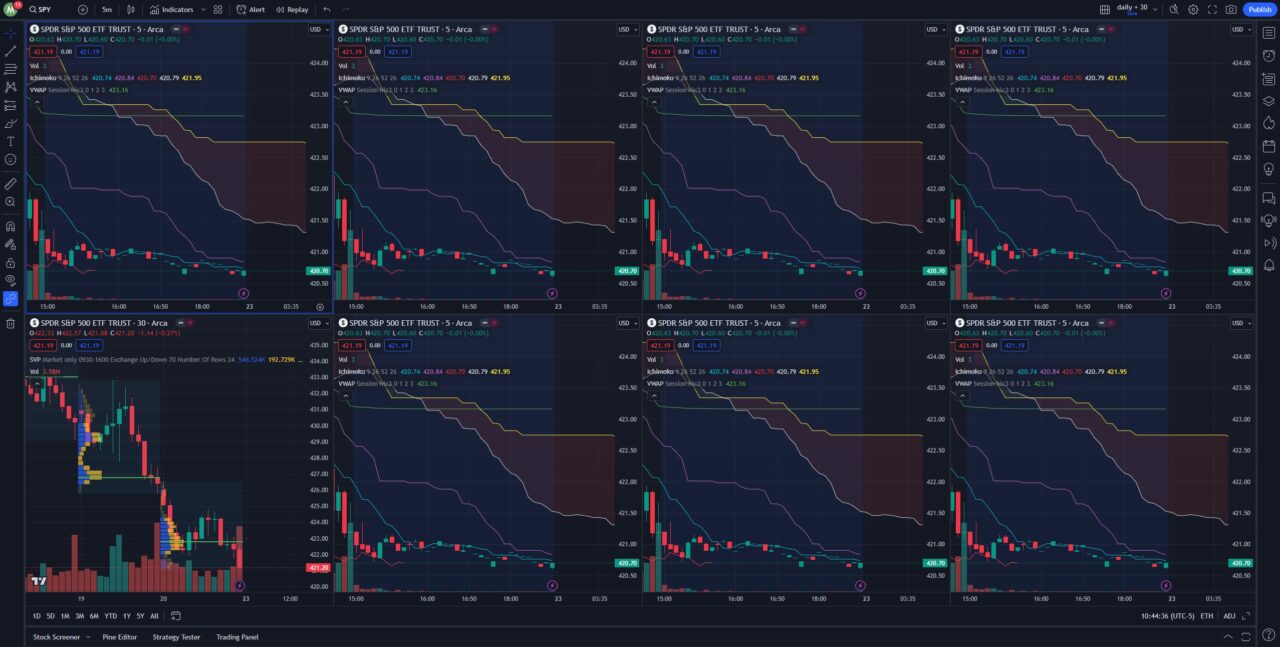
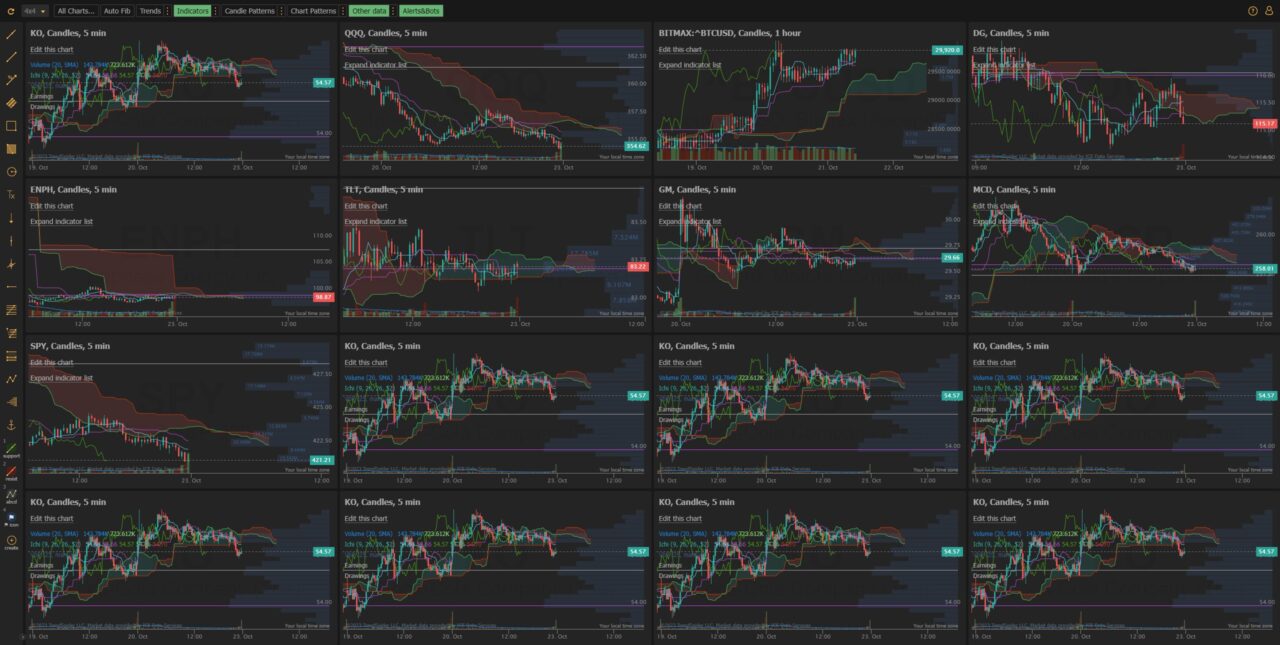
TrendSpider allows you to view up to 16 charts per layout, which is more than TradingView’s non-professional plans, which only offer up to 8 charts per layout.

This can give you more flexibility and convenience when analyzing multiple markets or timeframes at once. However, if you need more than 8 charts per layout on TradingView, you can upgrade to a professional plan that offers up to 16 charts per layout.
Another difference is that TrendSpider allows you to sync your charts across different timeframes, which means that when you change the timeframe on one chart, it will automatically change on all the other charts in the same layout.

This can help you keep your analysis consistent and save time when switching between timeframes. TradingView does not have this feature, but you can use its split-screen mode to view different timeframes side by side.
You can read this article to learn more about using TradingView multiple charts.
Screeners
Both TradingView and TrendSpider offer excellent stock screeners that allow you to filter stocks based on various criteria. However, there are some differences in their stock screeners that might affect your trading results.
TradingView Screeners
TradingView offers a technical and fundamental screener that allows you to filter stocks by technical and fundamental criteria, such as price, volume, indicators, earnings, dividends, ratings, and more.
You can also use TradingView’s social network integration to find stocks that are popular or trending among other traders. You can access live streams, trade signals, chat rooms, and more from TradingView’s social network.
TrendSpider Screeners
TrendSpider offers a technical screener that incorporates pattern recognition and alternative data integration. You can filter stocks by technical criteria, such as indicators, patterns, timeframes, and more.
You can also use TrendSpider’s pattern recognition feature to find stocks that match specific chart patterns or candlestick patterns across multiple timeframes. Additionally, you can use TrendSpider’s alternative data integration to find stocks that have unusual options volume, high social media sentiment, positive analyst estimates, high dark pool volume, high short volume, and more.
TradingView vs. TrendSpider – Bottom Line
Overall, I believe TradingView is the best platform for most traders since you can test out most of the features for free, and the paid plans are generally cheaper. However, I do recommend you try out both platforms before committing to one.
TrendSpider may be the better option if you are serious about trading and want access to the most charts per layout possible. It is also the better option if you enjoy using the helpful AI assistant and want real-time data included in the premium price.
TradingView Summary
- Starting price: $12.95 per month billed annually
- Ability to use the platform for free
- Over 1,000 built-in indicators
- Advanced indicators like footprint charts, TPO charts, volume profile, and more
- Up to 16 charts per layout with a professional plan
- Advanced screeners, heatmaps, calendars, backtesting, and other useful tools
TrendSpider Summary
- Starting price: $107 per month (save 25% with my discount link)
- Real-time data included in the premium price
- An AI assistant that can perform actions based on anything you type
- Up to 16 charts per layout
- AI-powered screeners, backtesting, fundamental data, and more useful tools
You can watch my video review of TrendSpider and my video review of TradingView to see the pro features of both platforms live in action.
If you have made it this far, learn how to use our TrendSpider coupon code to get a discount on your subscription!

Related Articles
– Free trading journal template & cheat sheet PDFs
– Access our custom scanners and watchlists
– Access our free trading course and community!


