How to Use the TradingView Stock Screener to Find Stocks to Trade
Discover how to use the TradingView stock screener to find hidden trading opportunities.
Where is the stock screener in TradingView?
You can find the TradingView stock screener at the bottom of the homepage, or under Products > Screeners. They have a stock screener, a forex screener, a crypto pairs screener, and a crypto coins screener.

Is TradingView stock screener free?
Many of the features of the TradingView stock screener are free. However, intraday screeners are only available with a premium subscription.
If you want to test the premium TradingView stock screeners for free, TradingView usually offers a 30-day free trial for new users.
How to Use the TradingView Stock Screener
There are several ways to use the TradingView stock screener. For example, you can search for companies with low P/E ratios, determine stock trends, view financial data, and more.
TradingView Stock Screener Column Options
The column options of the screener allow you to view specific data about the stocks that populate based on your screener settings. We will cover the screener options in the next section.
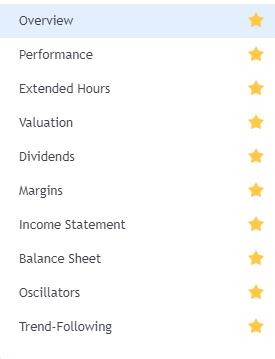
Overview
The overview column will show you basic information such as a stock’s market cap, price, and volume.
Performance
The performance column will show you how a stock has been performing over several time periods.
Extended Hours
The extended hours column will give you data such as a stock’s pre-market and post-market change and close prices.
Valuation
The valuation column shows a stock’s P/E ratio, market cap, EPS, EV, and more.
Dividends
The dividend column shows a stock’s dividend yield, dividend per share, and current price.
Margins
The margins tab shows fundamental margins such as gross, operating, and pretax margins.
Income Statement
The income statement column portrays an overview of a company’s income statement with metrics like revenue, EPS, and EBITDA.
Balance Sheet
The balance sheet column shows you fundamental data such as the current ratio, debt/equity, quick ratio, and net debt.
Oscillators
The oscillators will show you some technical signals, such as the ATR, MACD level, and the oscillator’s rating.
Trend-Following
The trend-following column will give you weak to strong buy/sell signals based on moving averages and technical trends.
TradingView Stock Screener Screen Options
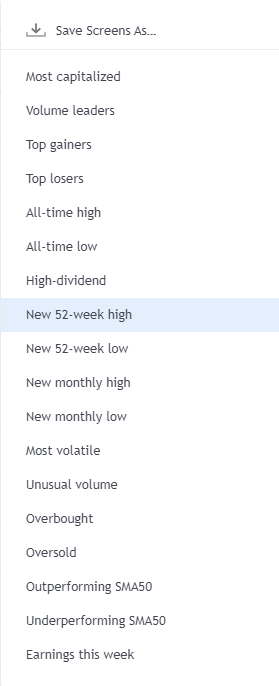
The screener options allow you to filter through companies with several data points, such as the following. Once you filter to see the right stocks, you can use the column options we reviewed to view specific data about the companies that populate.
Most capitalized
The most capitalized screener will show you the stocks with the highest market capitalizations.
Volume leaders
The volume leaders will populate stocks with the highest trading volume for a particular day.
Top gainers
The top gainers screener will show you the stocks increasing the most that day.
Top losers
The top losers screener will show the stocks decreasing the most that day.
All-time high
The all-time high screener will find stocks that recently hit their all-time high.
All-time low
The all-time low screener will find stocks that are hitting their all-time lows.
High-dividend
The high-dividend screener will find stocks that pay the highest dividend yields.
New 52-week high
The new 52-week high screener finds stocks hitting their highest price of the last 52 weeks (year).
New 52-week low
The new 52-week low screener finds stocks hitting their lowest price in the last 52 weeks (year).
New monthly high
The new monthly high screener finds stocks hitting their high of the month.
New monthly low
The new monthly low screener finds stocks hitting their low of the month.
Most volatile
The most volatile screener finds stocks that fluctuate the most in either direction.
Unusual volume
The unusual volume screener finds stocks that have more volume than usual.
Overbought
The overbought screener finds stocks that are technically overbought (overpriced) based on various metrics.
Oversold
The oversold screener finds oversold (discounted) stocks based on various metrics.
Outperforming SMA50
This screener finds stocks above their 50-day moving average.
Underperforming SMA50
This screener finds stocks trading below their 50-day moving average.
Earnings this week
Discover stocks that have earnings in the current week using this screener.
TradingView Stock Screener Filters
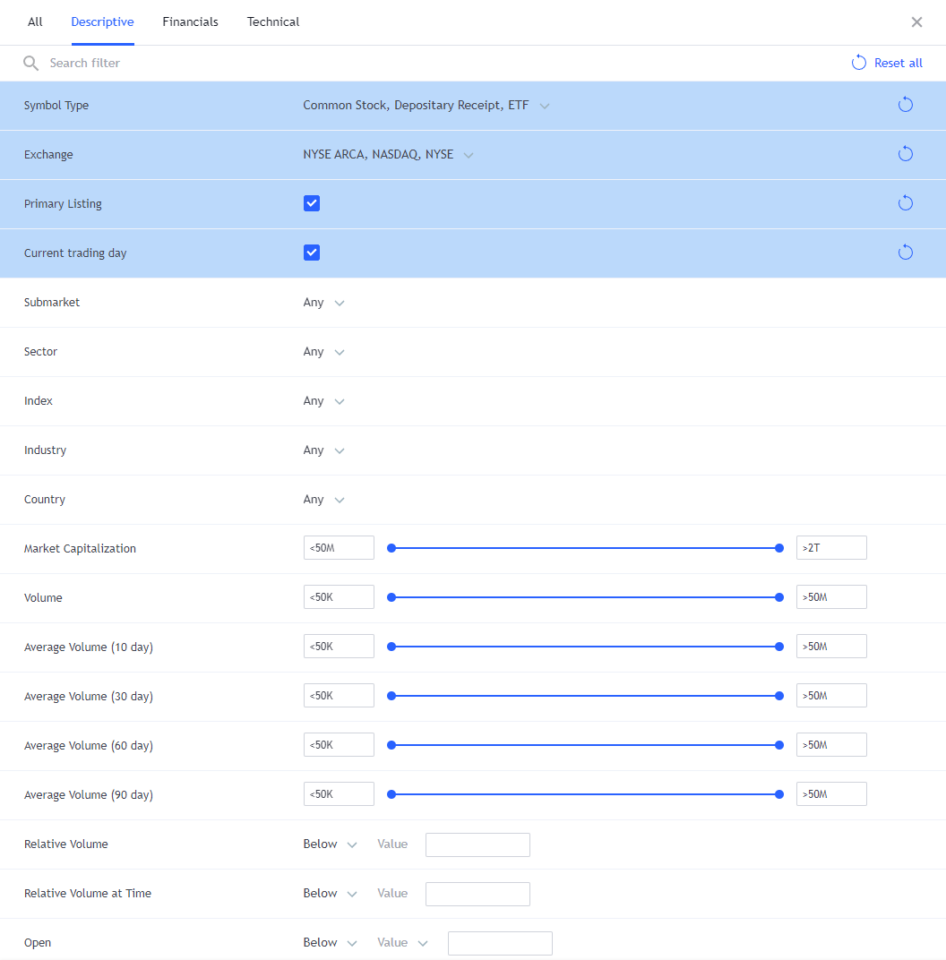
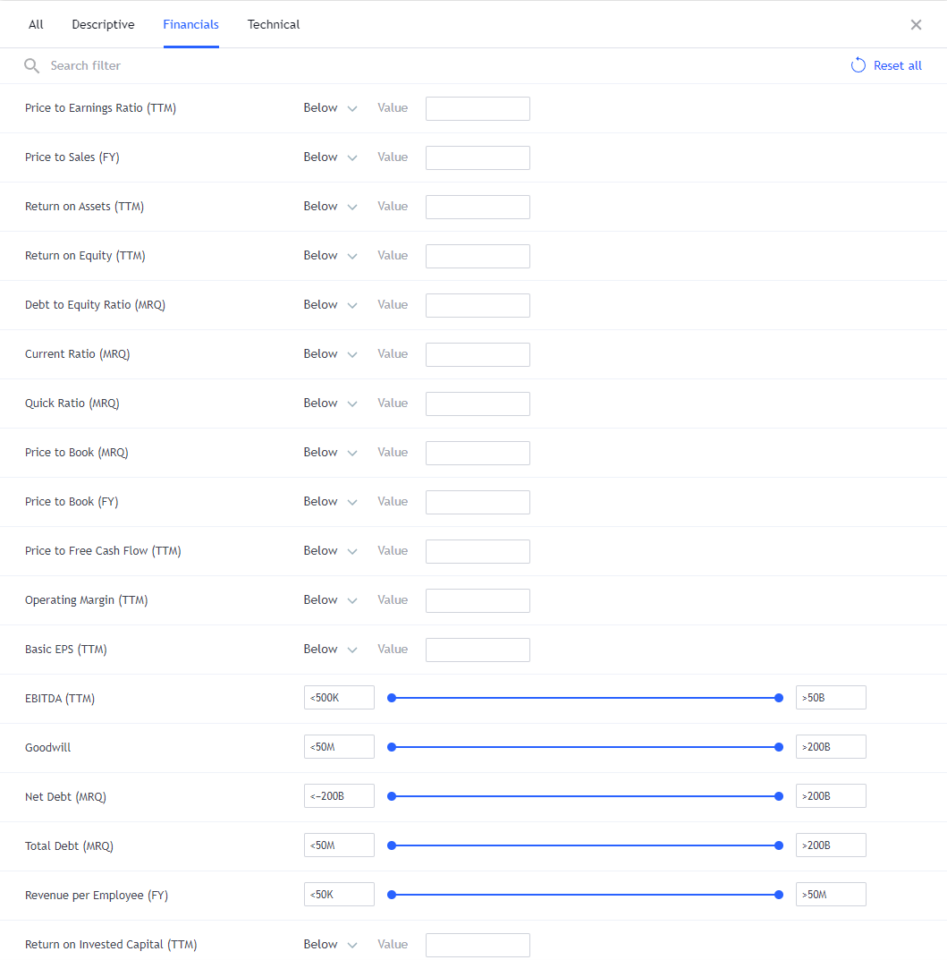
The filters allow you to filter out stocks that don’t meet certain criteria like the following:
Descriptive filters
Descriptive filters allow you to filter stocks by sector, index, country, and more.
Financial filters
The financial filters allow you to filter out stocks based on fundamental data such as P/E ratios, price to book, current ratio, and more.
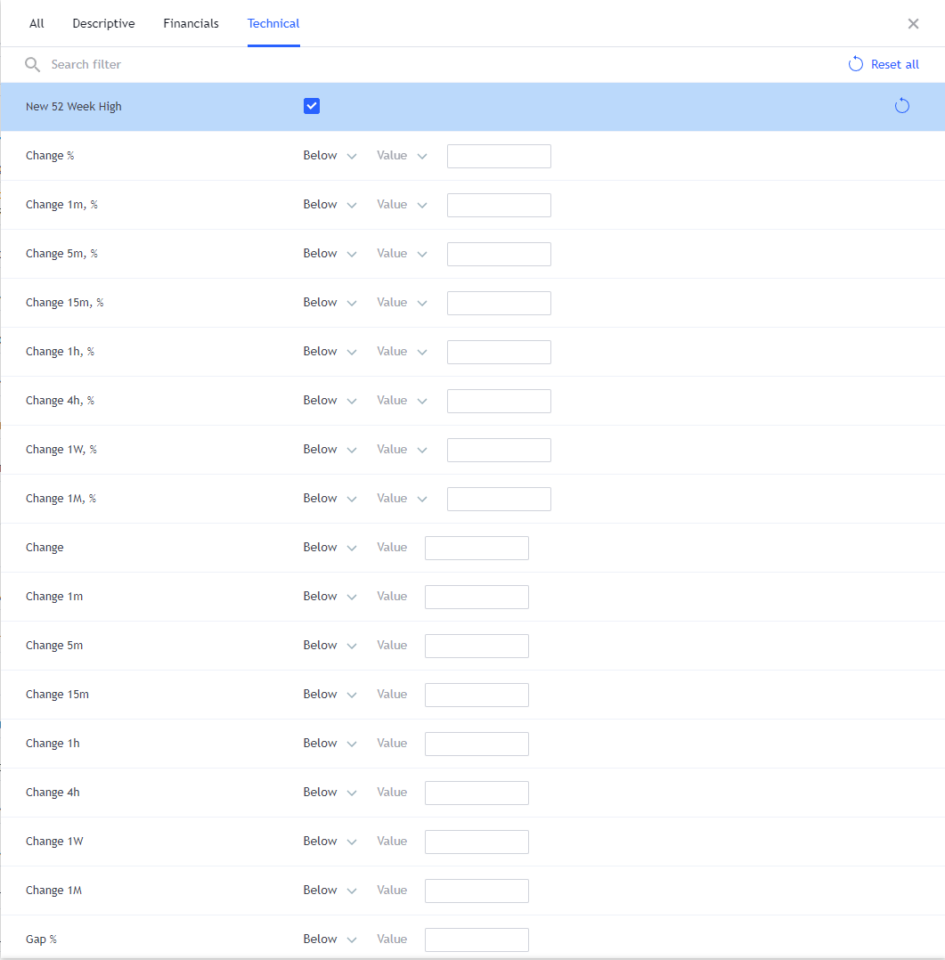
Technical filters
The technical filters allow you to discover stocks with various percent changes, gap moves, relative strength indexes, and more.
How Much Does TradingView Cost per Month?
TradingView has several packages ranging from $12.95/ month ($14.95 billed monthly) to $49.95/ month ($59.95 billed monthly.
If you want to test out TradingView before purchasing a premium plan, new users can usually get a free TradingView free trial.
Before you go
If you want to keep educating yourself about personal finance, you must check out these posts as well:
What is the Most Successful Options Strategy
Options Trading for Income: The Complete Guide
Mark Minervini’s Trading Strategy: 8 Key Takeaways
The Best Options Trading Books
The Best Laptops and Computers for Trading
How to Get a TradingView Free Trial
The Best TradingView Indicators
The Best Keyboards For Trading
This article contains affiliate links I may be compensated for if you click them.
Get Your Free Trading Resources
Grab the free trading journal template plus the same tools we use to stay organized, consistent, and objective.
- Free trading journal template
- Custom indicators, watchlists, and scanners
- Access our free trading community
Enter your email below to get instant access.
No spam. Unsubscribe anytime.


