How to Add Volume in TradingView Chart: A Simple Guide
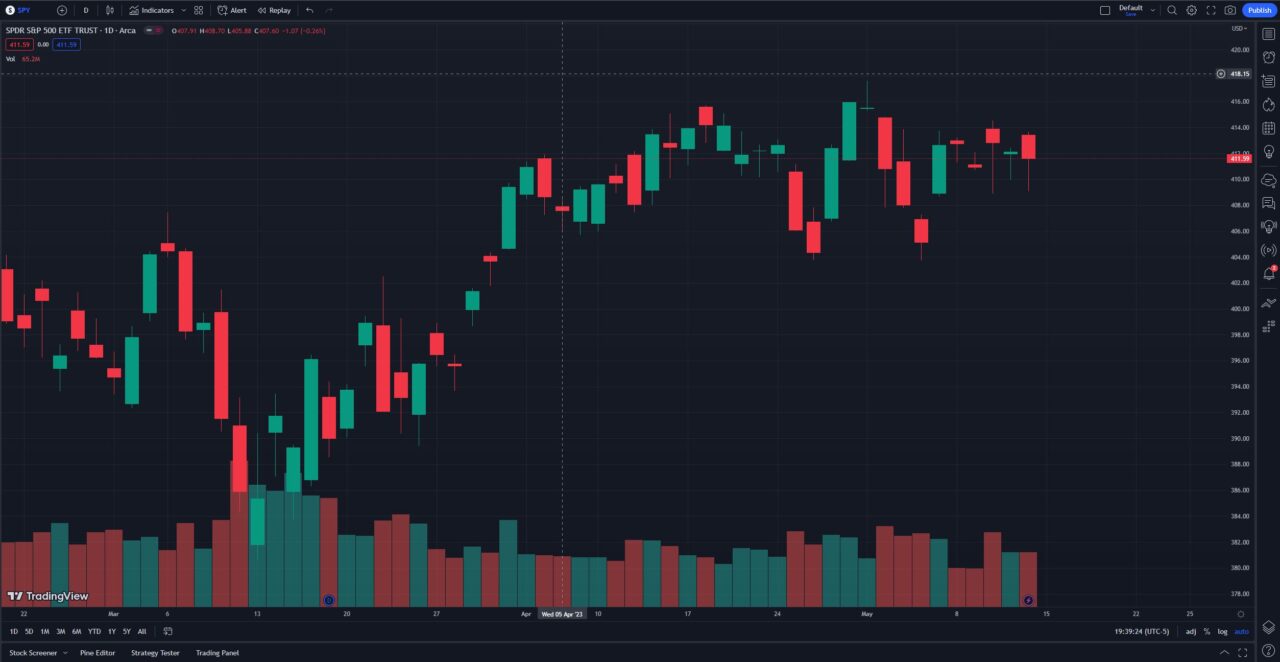
By default, TradingView does not show the volume bars at the bottom of the chart. This article will walk you through how to add and utilize the volume indicator in your TradingView charts.
How to Add Volume to Your TradingView Chart
Adding the volume indicator on TradingView is straightforward. Follow these steps:
- Open TradingView and navigate to the chart of interest.
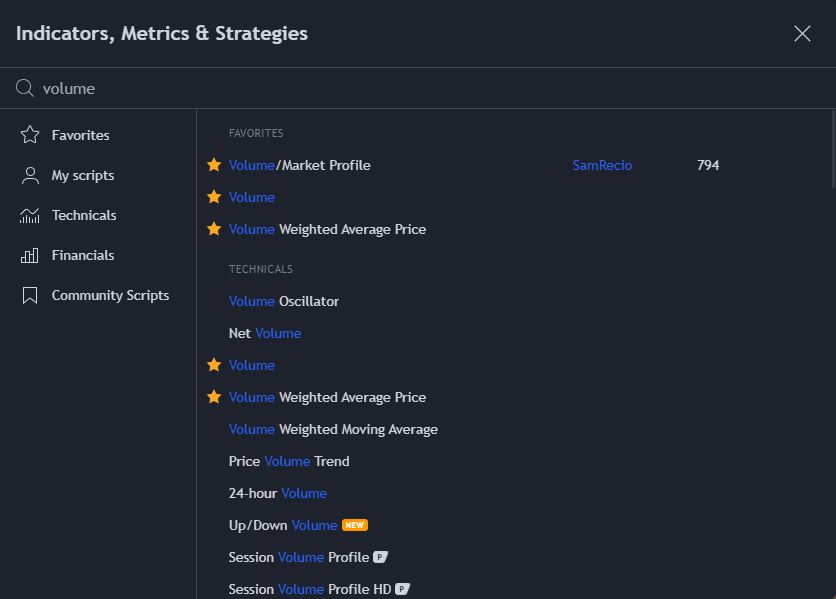
- Click “Indicators” at the top left of the chart.
- In the search bar within the indicators window, type “Volume.”
- Click on the “Volume” indicator in the search results to select it.
- The volume indicator will now be on your chart when you close the indicator window.

You can also watch my quick video about how to add volume in TradingView for a visual walkthrough below:
TradingView Limited Time Offer!
Exclusive Deal: 30-Day FREE Premium Access + Bonus Credit
Don’t Miss Out – Sign up for TradingView Now!
- Advanced Charts
- Real-Time Data
- Track all Markets
Understanding Trading Volume
Trading volume plays a crucial role in understanding market trends. It measures the number of shares or contracts traded in a specific time period, providing insights into the intensity of a price movement. Dive deeper into the concept of trading volume to strengthen your trading strategies.
Why Volume Matters on TradingView
When you’re trading, you need every bit of information at your disposal. Volume gives you an insight into the strength or weakness of a price move.
High volume might indicate a strong move, while a price move on low volume could be less significant. Adding the volume indicator to your TradingView chart helps you gauge the buying and selling pressure in the market.

Strategies for Effective Volume Indicator Use
Once you’ve added the Volume Indicator, it’s important to utilize it effectively.
Understanding how volume relates to price moves can help inform your trading decisions. For example, a high volume surge on an upward price move could indicate a strong bullish sentiment.
Learn more about using volume in trading with this guide on how VWAP uses volume data.
TradingView Volume Profile
While the Volume Indicator is a powerful tool, it’s not the only volume-based tool on TradingView. The Volume Profile, for instance, provides a more detailed view of trading activity at specific price levels.
Explore more about the Volume Profile on TradingView to broaden your trading toolkit. The volume profile is a powerful indicator that’s only available for TradingView members, but new users can usually get a free trial and a discount using my link.
TradingView Limited Time Offer!
Exclusive Deal: 30-Day FREE Premium Access + Bonus Credit
Don’t Miss Out – Sign up for TradingView Now!
- Advanced Charts
- Real-Time Data
- Track all Markets
FAQs
Does TradingView have a volume indicator?
- Yes, TradingView does feature a volume indicator, and you can add it to your chart following the steps outlined above.
How do I enable Volume Profile on TradingView?
- TradingView also provides a Volume Profile tool. Check out our guide on how to use Volume Profile on TradingView.
How do I add volume to my TradingView Pine script?
- Adding volume to your Pine script involves using built-in variables.
How do you use volume as an indicator?
- Volume can be used to assess the strength or weakness of a price movement. For more, check out our post on how VWAP uses volume data.
What are the best volume indicators for TradingView?
- There are many volume indicators available on TradingView, including the Volume Indicator, Volume Footprint Charts, and Volume Profile. The best one depends on your trading style and needs.
This article contains affiliate links I may be compensated for if you click them.
– Free trading journal template & cheat sheet PDFs
– Access our custom scanners and watchlists
– Access our free trading course and community!


