Morning Star Pattern: A Bullish Reversal Signal
Candlestick patterns are powerful tools used by traders and investors in technical analysis. One such pattern that often grabs the attention of market participants is the morning star pattern—a notable bullish reversal pattern that signals a potential bottom in a downtrend.
In this article, we’ll explore the characteristics of the morning star pattern, its reliability, the psychology behind its formation, and how you can analyze it using TradingView.

Understanding the Morning Star Candlestick Pattern
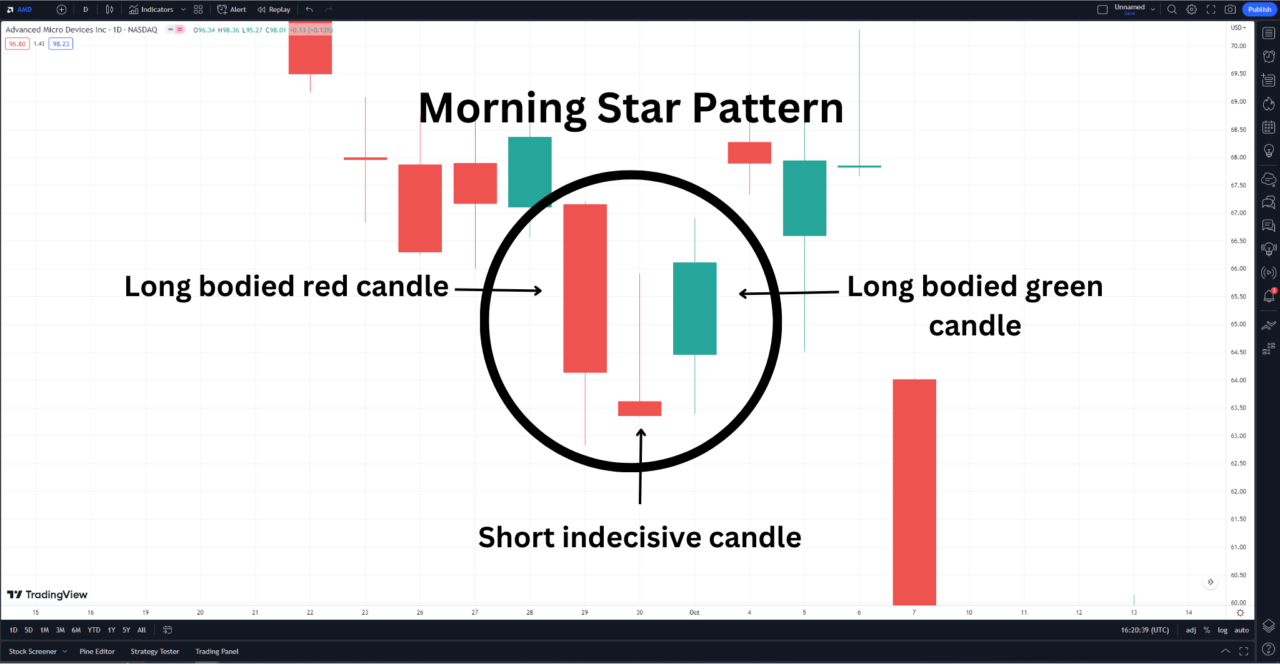
The morning star pattern is a three-candle formation that typically occurs at the end of a downtrend:
- The first candle is a long-bodied bearish (red or black) candle that indicates the bears’ control and extends the current downtrend.
- The second candle is a short indecisive candle, often a doji or spinning top, that signals market indecision. It may gap down from the first candle.
- The third candle is a long-bodied bullish (green or white) candle that signals a reversal in the trend. It often gaps up from the second candle and closes above the midpoint of the body of the first candle.
Bullish or Bearish: Nature of the Morning Star Pattern
The morning star pattern is a bullish reversal pattern that indicates a potential shift from a bearish trend to a bullish trend. In contrast, the evening star pattern is its bearish counterpart, signaling a reversal from an uptrend to a downtrend.
Reliability of the Morning Star Candlestick Pattern
While the morning star pattern is seen as a reliable indicator of a trend reversal, traders should be cautious as no pattern guarantees a certain outcome. Factors that can enhance the reliability of the pattern include:
- Confirmation with other technical indicators
- Increased volume on the third candlestick
- Occurrence after a well-defined downtrend
Psychological Behavior Behind the Pattern
The formation of the morning star pattern reflects changing market sentiment:
- On the first day, the bears dominate, pushing the price lower and forming a long bearish candle.
- On the second day, uncertainty arises as neither the bears nor the bulls take control, resulting in a short indecisive candle.
- On the third day, renewed buying interest from the bulls leads to a gap up opening and a long bullish candle, confirming the bullish reversal.
Trading with the Morning Star Pattern
Traders can use the morning star pattern as a potential buy signal. However, it’s essential to confirm the pattern with other technical indicators and assess the overall market conditions before making trading decisions.
Analyzing Patterns with TradingView
TradingView is a popular platform for technical analysis that offers a wide range of features for analyzing candlestick patterns. Users can access advanced charting tools and customize their analysis to suit their trading style.
Plus, TradingView is offering a 30-day free trial and a discount on your subscription when you use my link, so you can get started with your technical analysis journey today!

Morning Star Pattern | Bottom Line
The morning star pattern is a valuable tool for identifying potential bullish reversals in the market. By understanding its characteristics, reliability, and the psychology behind its formation, traders can make more informed decisions.
Remember, successful trading involves careful analysis and a well-rounded approach, so consider the morning star pattern as part of your trading toolkit.
This article contains affiliate links I may be compensated for if you click them.
– Free trading journal template & cheat sheet PDFs
– Access our custom scanners and watchlists
– Access our free trading course and community!


