Inverted Hammer Candlestick: Decoding a Bullish Reversal Pattern
An Intriguing Pattern in Technical Analysis
The world of technical analysis is replete with fascinating candlestick patterns that traders and investors use to navigate the financial markets. Among these patterns, the inverted hammer stands out as a potential harbinger of a bullish trend reversal.
This article will explore the inverted hammer pattern, its interpretation, and its significance in trading strategies. TradingView offers a powerful charting platform for those keen on technical analysis, complete with a $30 discount and a 30-day free trial when you use my link.
Decoding the Inverted Hammer
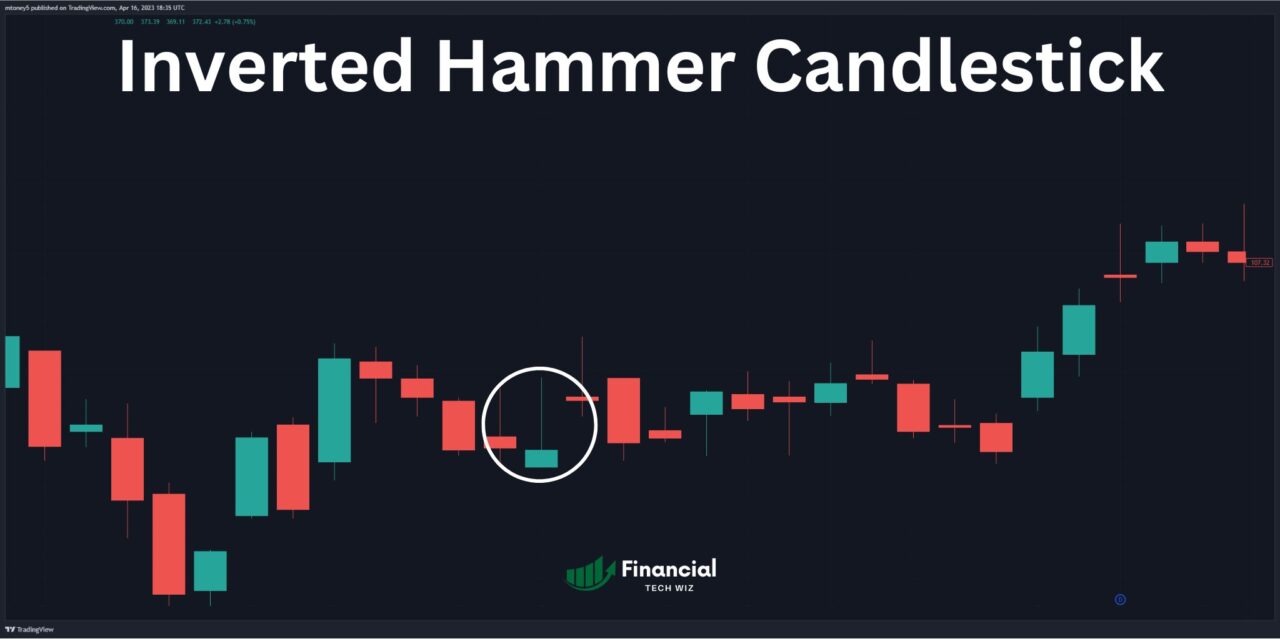
The inverted hammer is a single candlestick pattern that typically appears at the bottom of a downtrend. The key characteristics of this pattern include:
- Open, low, and close prices that are approximately the same
- A long upper shadow/wick, at least twice the length of the real body
- A small lower body, which can be either red or green. Even a red hammer candlestick signals a bullish reversal.
This pattern tells a compelling story about the struggle between buyers and sellers in the market.

Interpreting the Signal and Market Psychology
The inverted hammer is regarded as a bullish signal, suggesting a possible reversal from a bearish to a bullish trend. But is an inverted hammer always bullish? And how accurate is it? Let’s explore:
- The pattern indicates weakening bearish momentum, with sellers unable to drive prices lower.
- Buyers make an attempt to push prices higher, but selling pressure prevents a sustained rally.
- The emergence of the pattern at the bottom of a downtrend suggests a shift in market sentiment.
However, traders must exercise caution and seek confirmation before making decisions.
Strategies and Considerations for Trading
When trading based on the inverted hammer, consider the following steps:
- Seek confirmation: A bullish candle that exceeds the high of the inverted hammer may confirm a trend reversal.
- Use additional indicators: Reinforce your analysis with other technical indicators or support and resistance levels.
- Manage risk: Define strict stop-loss levels, typically below the low of the inverted hammer, to mitigate risk.
The win rate of the inverted hammer may vary, so it’s crucial to evaluate the broader market context. For in-depth technical analysis, traders can explore TradingView.
Parallels and Contrasts with Similar Patterns
The inverted hammer bears resemblance to other patterns, such as the doji candle. While the doji has a minimal body, the inverted hammer has a small body with a long upper shadow.
Moreover, the morning star and evening doji star patterns signal bullish and bearish reversals, respectively. The cup and handle pattern is another bullish continuation pattern worth exploring.
The Bullish Hammer Candle
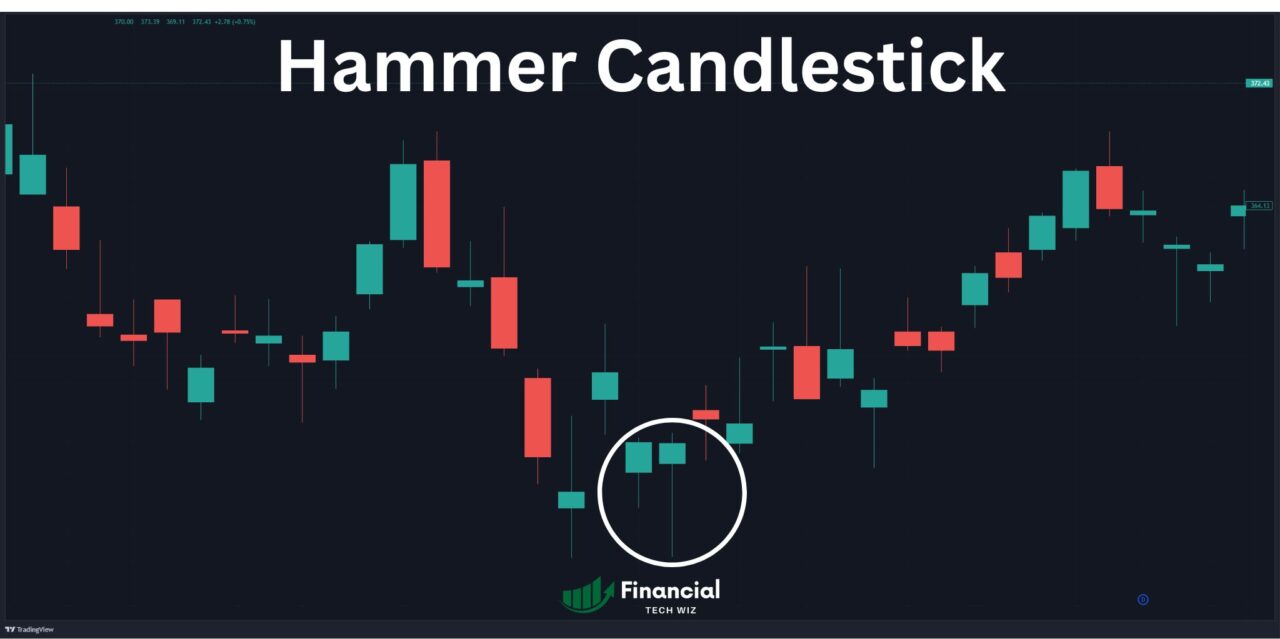
The bullish hammer candle is a bullish reversal pattern, much like the inverted hammer, but with distinct features. The hammer is characterized by a small body and a long lower shadow, indicating a potential reversal to the upside after a downtrend. While both the hammer and the inverted hammer are bullish signals, their appearance and placement in the context of a trend are key differentiators:
- The bullish hammer pattern typically appears at the bottom of a downtrend, signaling the potential for a bullish reversal. The defining feature of the hammer is its long lower shadow, which represents the rejection of lower prices by the market.
- The inverted hammer also emerges at the bottom of a downtrend and hints at a possible bullish reversal. The inverted hammer is distinguished by its long upper shadow, reflecting the buyers’ attempt to drive prices higher during the period.
Both patterns highlight moments of hesitation and shifting momentum in the market, providing valuable insights for traders and investors looking to capitalize on trend reversals.

Long-Term Perspectives and Opportunities
Long-term investors can leverage the inverted hammer pattern to identify trend reversal opportunities. By strategically buying quality stocks near the bottom, investors can enhance their portfolios. Consider the following approach:
- Wait for the market to stabilize and show signs of an upward trajectory.
- Take positions when trend reversal candles, such as the inverted hammer, appear on the chart.
- Start with a small position and accumulate more shares as the stock price rises.
This strategy allows investors to achieve a lower average purchase price and mitigate risk.
Recap: Key Insights on the Inverted Hammer Candlestick
Let’s summarize the essential points covered in this article:
- The inverted hammer is a bullish reversal pattern that appears at the bottom of a downtrend.
- The pattern signals a struggle between buyers and sellers, with buyers attempting to gain control.
- Confirmation is crucial—traders should seek additional signals before making trading decisions.
- Comparable patterns like the doji, morning star, and hammer offer valuable insights.
The inverted hammer is a powerful tool, but it’s not infallible. Prudent risk management and a comprehensive understanding of the market are vital for success.
Conclusion: A Beacon of Reversal in the Market Landscape
The inverted hammer candlestick pattern is a valuable indicator for traders and investors seeking to navigate the ever-changing financial markets. Whether you’re a seasoned trader or a curious investor, mastering this pattern can enhance your technical analysis toolkit.
As you continue your journey in the world of technical analysis, consider exploring other candlestick patterns and enriching your knowledge. For those looking to delve deeper, TradingView offers a comprehensive charting platform with a $30 discount and a 30-day free trial for those looking to delve deeper when you use my link.
Remember, financial markets are dynamic, and the inverted hammer is just one of many beacons that can illuminate the path ahead.
This article contains affiliate links I may be compensated for if you click them.
– Free trading journal template & cheat sheet PDFs
– Access our custom scanners and watchlists
– Access our free trading course and community!


