Understanding the Dragonfly Doji Candlestick Pattern
Dragonfly Doji Introduction
Candlestick patterns are powerful tools used by traders and investors to analyze price movements and make informed trading decisions. Among the various candlestick patterns, one that stands out for its unique appearance and potential significance is the dragonfly doji. This article will explore the characteristics, interpretation, and practical use of this intriguing pattern.

Characteristics of the Dragonfly Doji
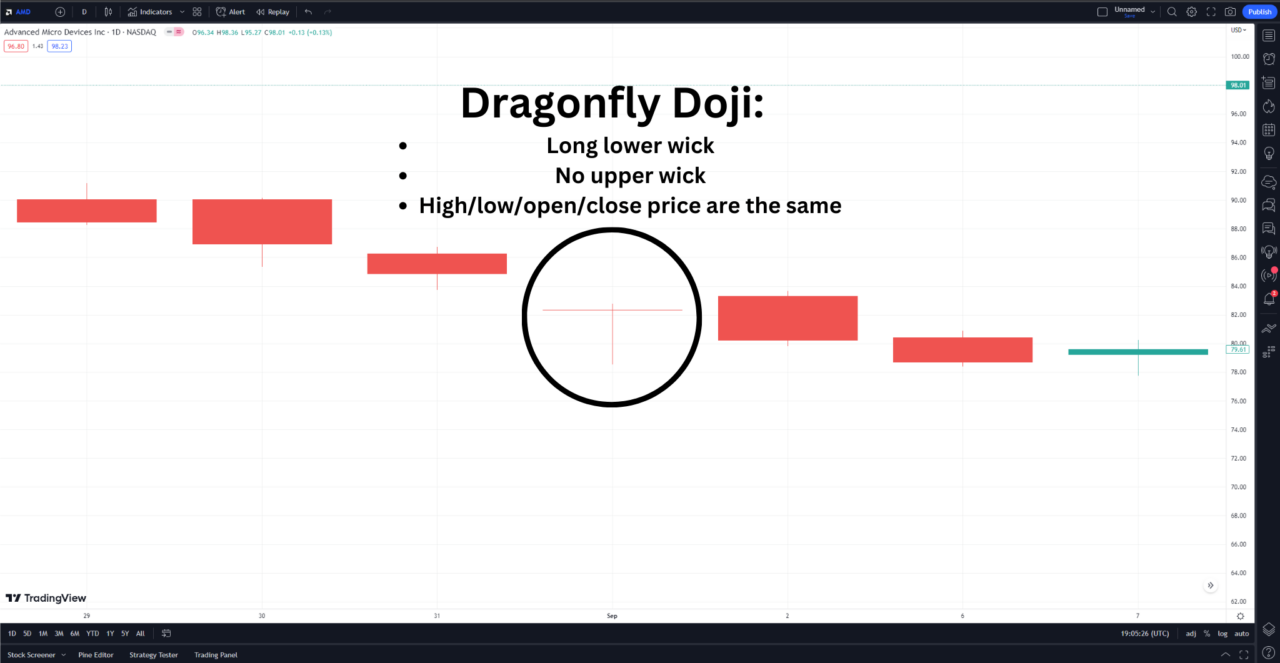
- Visual Appearance: The dragonfly doji is characterized by a long lower shadow (wick) and a small or nonexistent upper shadow, forming a “T” shape. The open, close, and high prices of the asset are at the same or very close level.
- Color: While the color of the dragonfly doji can be red or green, the primary focus is on its shape and the context in which it appears.
Interpretation and Significance
- Bullish Signal: The dragonfly doji is often considered a bullish reversal signal when it occurs after a downtrend. It indicates that sellers pushed the price down, but buyers were able to absorb the selling pressure and push the price back up to the opening level.
- Bearish Signal: Conversely, when the dragonfly doji appears after an uptrend, it could indicate a potential bearish reversal if followed by a downward confirmation candlestick.
- Confirmation: Traders typically wait for a confirmation candlestick to validate the dragonfly doji signal. The pattern is stronger when accompanied by higher-than-usual trading volume.
Comparison with Other Candlestick Patterns
- Dragonfly Doji vs. Hammer: The hammer pattern is similar to the dragonfly doji but may have a small body. Both patterns are bullish reversal signals at the bottom of downtrends.
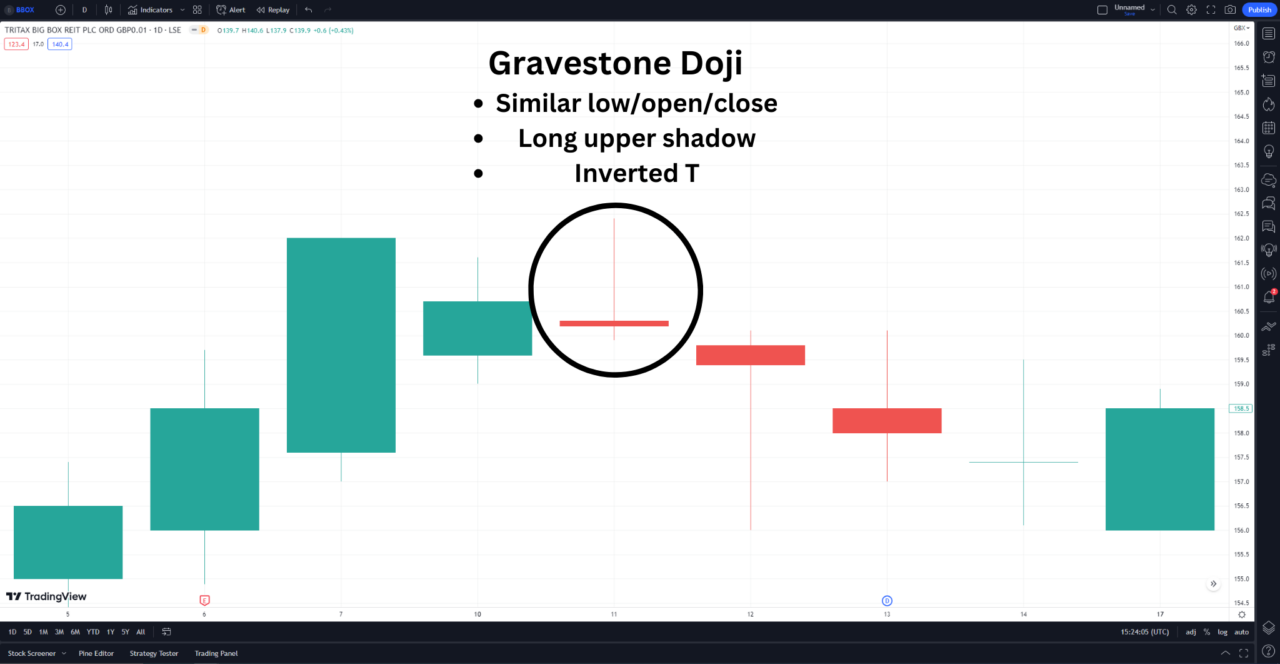
- Gravestone Doji: The gravestone doji is the opposite of the dragonfly doji. It has a long upper shadow and signals a bearish reversal at the top of uptrends.

TradingView: A Powerful Charting Platform
TradingView is a leading charting and technical analysis platform that offers a wide range of tools for analyzing candlestick patterns, including the dragonfly doji.
Users can take advantage of a 30-day free trial to explore the platform’s features and benefit from a $30 discount on subscription using my link.
Practical Use and Limitations
- Technical Indicators: The dragonfly doji works best when used alongside other technical indicators, such as support and resistance levels, moving averages, and volume profile.
- Trading Volume: Pay attention to trading volume, as higher volume during the formation of the dragonfly doji adds credibility to the pattern.
- Rarity: The dragonfly doji is a relatively rare pattern. It’s important to consider the overall market context when interpreting it.
- Limitations: Remember that no pattern guarantees a price reversal. Use the dragonfly doji as one tool among others in your trading strategy.
Tips for Using the Dragonfly Doji Effectively
- Context Matters: Always consider the overall market conditions and the prevailing trend before acting on the dragonfly doji signal.
- Risk Management: Use stop-loss orders to manage risk. Place stop-loss orders below the low of a bullish dragonfly or above the high of a bearish dragonfly.
- Trade Exit: Have a clear exit strategy in place to secure profits and minimize losses.
Dragonfly Doji Candlestick | Bottom Line
The dragonfly doji is a valuable technical indicator for identifying potential trend reversals. Whether you’re a seasoned trader or a beginner, understanding this pattern can enhance your trading toolkit.
As always, use the pattern wisely, in combination with other tools, to make informed and successful trading decisions.
This article contains affiliate links I may be compensated for if you click them.
– Free trading journal template & cheat sheet PDFs
– Access our custom scanners and watchlists
– Access our free trading course and community!


