ChartMill Stock Screener Review
ChartMill is a web based tool for stock screening and analysis and offers a set of technical and fundamental analysis based tools for individual traders and investors.
The ChartMill stock screener is one of the most versatile screeners on the market, suitable for a wide range of strategies, ranging from short-term day or swing trading to fundamental analysis for long-term growth, value, quality or dividend investing, or combining TA and FA for growth- position trading.
While ChartMill covers all the regular things you would expect from a stock screener, we will focus in this article on the items which set it apart from other screeners.
Technical and Fundamental reports
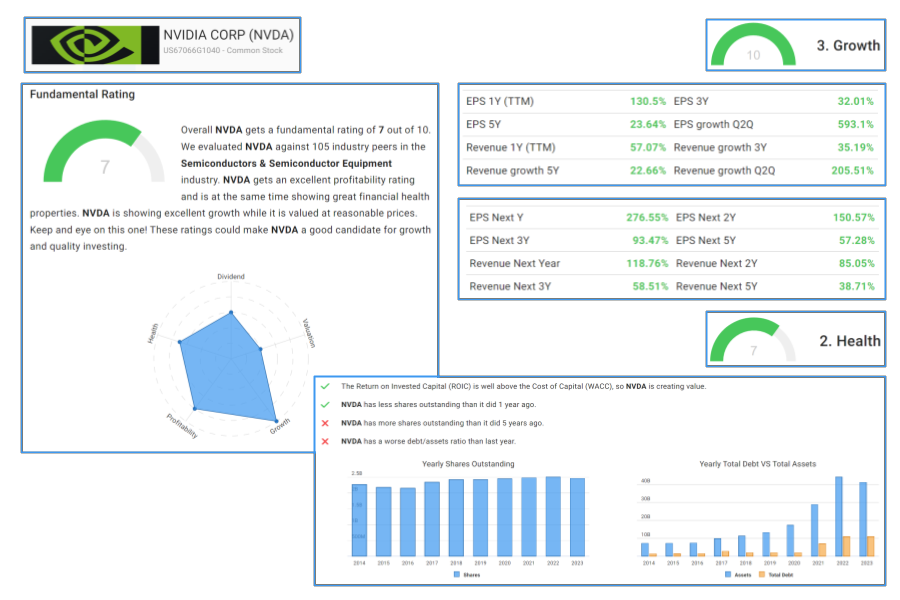
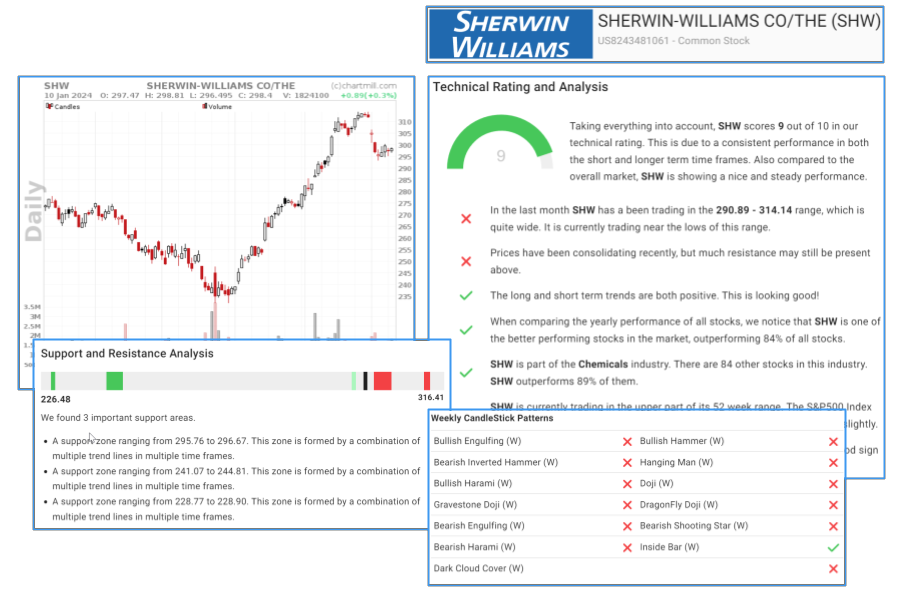
For every stock available in the system ChartMill provides a Technical Analysis and Fundamental analysis report. These reports are updated daily and are easy to understand, also for people less familiar with either TA or FA.
The Fundamental Analysis Report will analyze the Profitability, Growth, Health, Valuation and Dividend aspects of a stock. Proprietary ratings are assigned for each aspect and give you a high level impression of the fundamentals for the stock you are looking at.

The Technical Analysis Report analyses the short and long term trends, the relative performance to the market and sector, the support and resistances zones and the Chart-and-Candlestick patterns observed. Based on this a Technical Rating is assigned to each stock. There is also a Setup Rating assigned, which measures to what extend a stock is consolidating and provides a good Technical entry point.

You can look at an example report for MSFT here.
Stock Screener and Screening library.
The [screener page](https://www.chartmill.com/stock/stock-screener?a=3) itself presents a wide range of filtering possibilities. Although they are nicely organized in sections it can take a bit of time before you are familiar with all the possibilities.
A good starting point is the trading ideas page where ChartMill provides a library of pre-configured screens to get you started. On this page you can search for screeners based on your favorite strategy (for instance swing trading, growth trading or investing or long term quality or value investing) and you will get a list of screens which you can run with just one click. The library includes screens from famous books and systems like Weinstein, CANSLIM. Minervini, Peter Lynch etc.
Starting from the pre-configured screens you get an insight into which filters were used and you can fine tune them to your own needs. Once you played around with some of the screens ideas for combining screens will be hard to stop.
Viewing Results

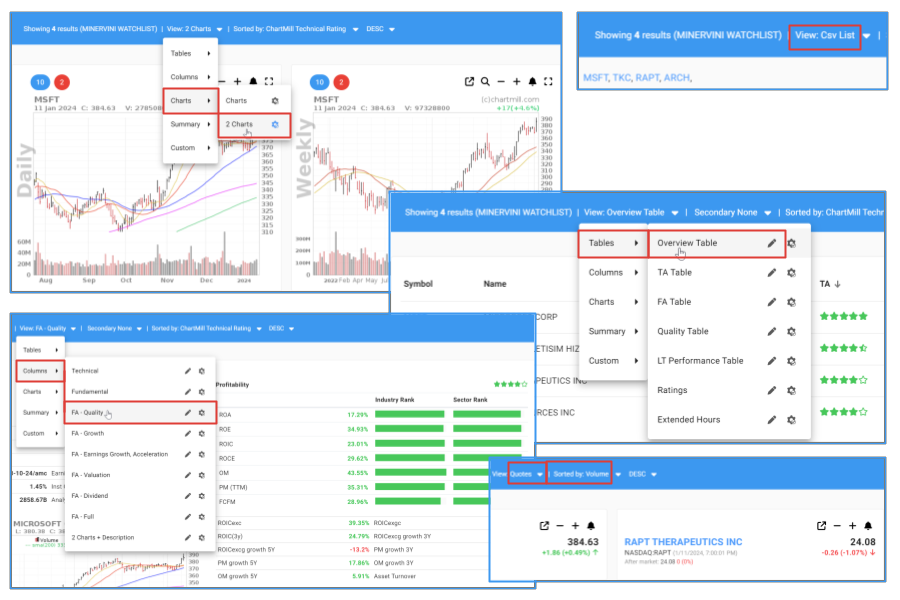
A stock screener gives results and you want to look at these results. We were quite impressed with the options ChartMill has to offer to do this in the most convenient way. There are many pre-configured views you can select from, but you can completely customize these views to see exactly what you want to see. Next to the classic table views there are also a column views which allow you to see a bit more data and can also include fundamental or technical charts.
A feature which will certainly be appreciated by traders is the possibility to view the results in charts. Also this can be configured and you can see many small charts or even full width charts. You can configure the indicators on the charts and display what you need. And even better: ChartMill also allows you to display 2 charts per result. This is useful to see for instance a daily next to a weekly or intraday chart.
For day, swing and position trading
As mentioned already above, swing traders will love seeing the results as (multiple) charts as this allows you to quickly browse many charts.
There are many technical analysis filters which allow creating good screens for swing traders, we will just highlight a couple of things you may want to check out:
- Breakout setups based on the consolidation score, squeeze plays, tight ranges, bull and high tight flags, triangle patterns, strong resistance areas.
- Automatic support and resistance detection which allow you to find stock near important support or resistance zones.
- Mean reversion strategies based on many indicators.
- Pullback strategies.
- Momentum Strategies.
- All of the above and Kullamägi and Minervini screens can be found in the screen library.
- A position sizing tool for risk management.
For growth trading and investing
ChartMill has an excellent offering for growth trading and investing as this is typically an area where fundamental and technical analysis go hand in hand.
In the screening library you will find pre-configured screens for CANSLIM and Minvervini systems, but also for names like Martin Zweig, Peter Lynch and Louis Navellier for instance.
Some things we can highlight in this context are:
- Technical indicators like Relative Strength, Pocket Pivots, Base recognition, Effective Volume for spotting accumulation of institutions.
- Long term EPS, Revenue and EBIT estimates.
- A growth rating from the fundamental analysis report, which can be combined with Health and Profitability ratings.
- A history of EPS and revenue surprises, which can be filtered on.
- Filters for earning estimate revisions.
- Growth acceleration filters.
For quality and value investing
Also for the long term investor using pure fundamental analysis ChartMill may be worth checking out. The screening library contains multiple Dividend, Value and Quality screens, including for instance a Terry Smith screen. Some things to highlight are:
- ChartMill Ratings allow you to find Healthy and Profitable stocks which are valued attractively or which qualify as quality stocks when they are also growing.
- Many individual Valuation, Health, Growth and Profitability ratios are available, including sector and industry ranks.
- More advanced metrics like different ROIC variants, ROCE, Piotroski, Interest Coverage, Cash Conversion, Capex/Sales, …. Are all available.
Educational Material
ChartMill also provides a rich library of articles and videos about indicators, ratios, patterns, risk management, trading and investing.
Free trial and Pricing
When you create an account on ChartMill a 14 day free trial will automatically start. Subscriptions are available from 25 USD per month when you sign up for a yearly subscription.
– Free trading journal template & cheat sheet PDFs
– Access our custom scanners and watchlists
– Access our free trading course and community!


