How to Use the TradingView Stock Screener to Find Stocks to Trade

tradingview stock screener columns

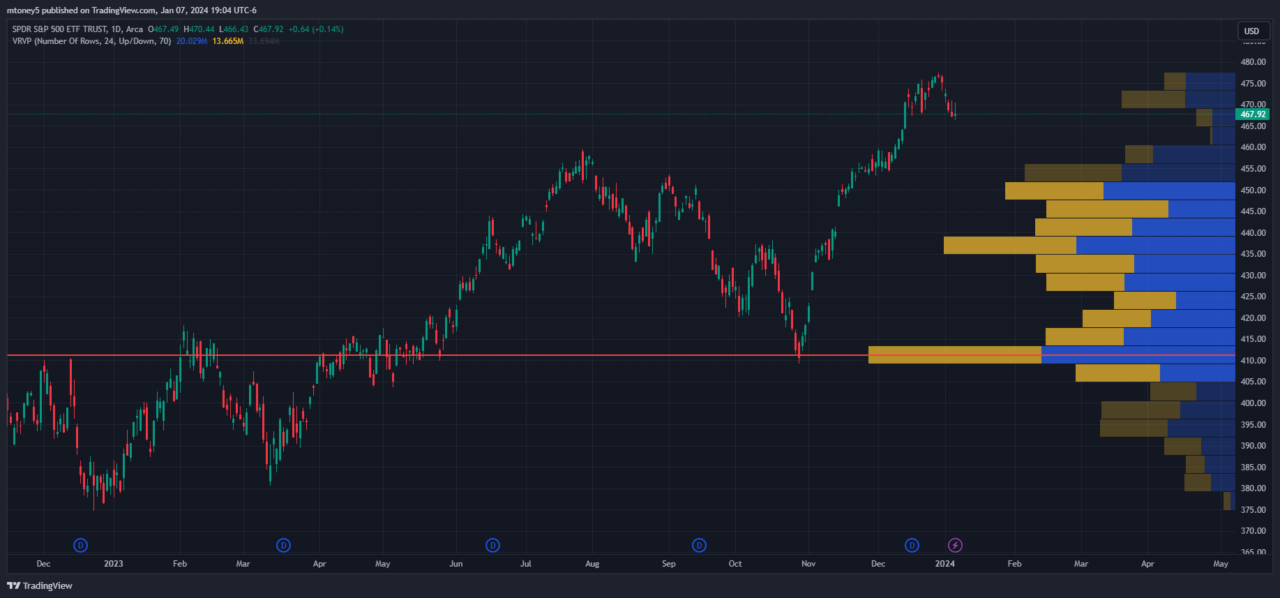
Discover how to use the TradingView stock screener to find hidden trading opportunities.

Where is the stock screener in TradingView?

You can find the TradingView stock screener at the bottom of the homepage, or under Products > Screeners. They have a stock screener, a forex screener, a crypto pairs screener, and a crypto coins screener.

tradingview stock screener homepage

Is TradingView stock screener free?

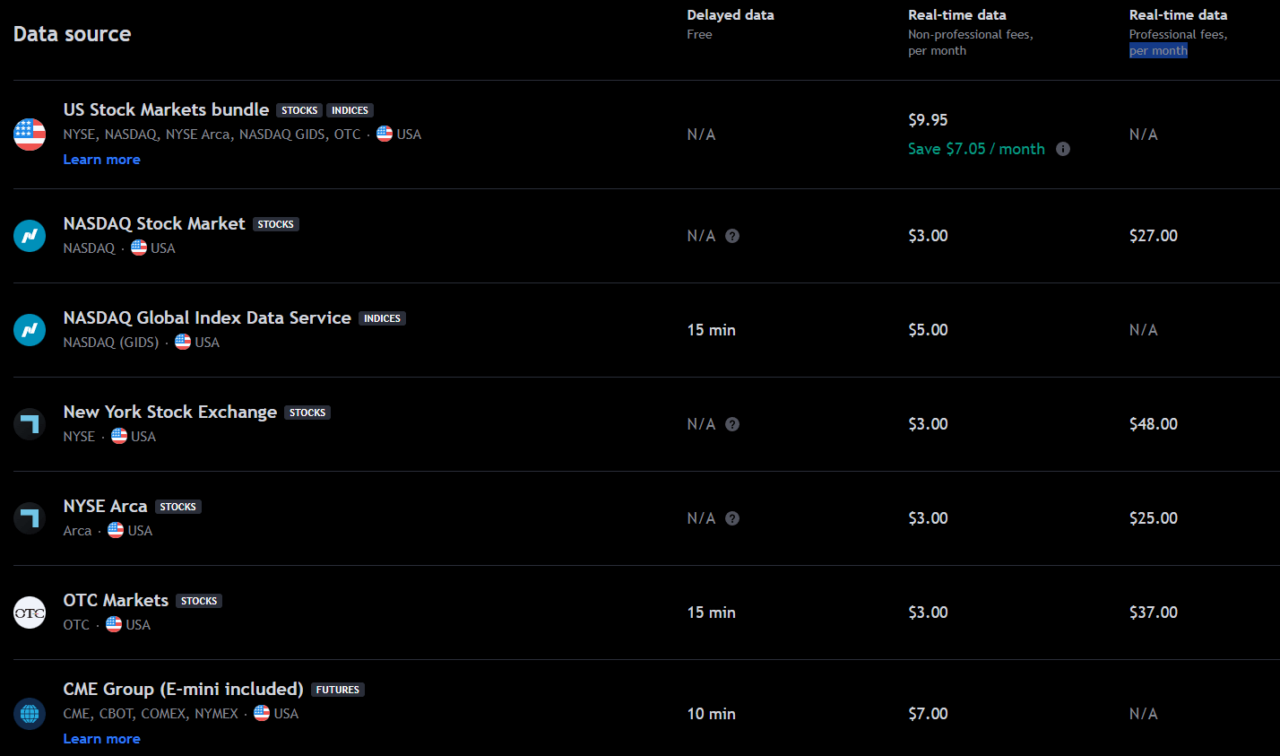
Many of the features of the TradingView stock screener are free. However, intraday screeners are only available with a premium subscription.

If you want to test the premium TradingView stock screeners for free, TradingView usually offers a 30-day free trial for new users.

How to Use the TradingView Stock Screener

There are several ways to use the TradingView stock screener. For example, you can search for companies with low P/E ratios, determine stock trends, view financial data, and more.

TradingView Stock Screener Column Options

The column options of the screener allow you to view specific data about the stocks that populate based on your screener settings. We will cover the screener options in the next section.
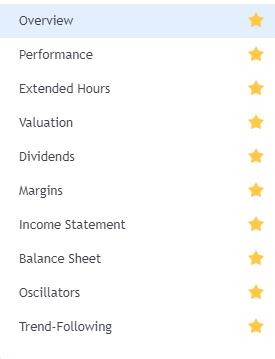
tradingview stock screener columns

Overview

The overview column will show you basic information such as a stock’s market cap, price, and volume.

Performance

The performance column will show you how a stock has been performing over several time periods.

Extended Hours

The extended hours column will give you data such as a stock’s pre-market and post-market change and close prices.

Valuation

The valuation column shows a stock’s P/E ratio, market cap, EPS, EV, and more.

Dividends

The dividend column shows a stock’s dividend yield, dividend per share, and current price.

Margins

The margins tab shows fundamental margins such as gross, operating, and pretax margins.

Income Statement

The income statement column portrays an overview of a company’s income statement with metrics like revenue, EPS, and EBITDA.

Balance Sheet

The balance sheet column shows you fundamental data such as the current ratio, debt/equity, quick ratio, and net debt.

Oscillators

The oscillators will show you some technical signals, such as the ATR, MACD level, and the oscillator’s rating.

Trend-Following

The trend-following column will give you weak to strong buy/sell signals based on moving averages and technical trends.

TradingView Stock Screener Screen Options

The screener options allow you to filter through companies with several data points, such as the following. Once you filter to see the right stocks, you can use the column options we reviewed to view specific data about the companies that populate.
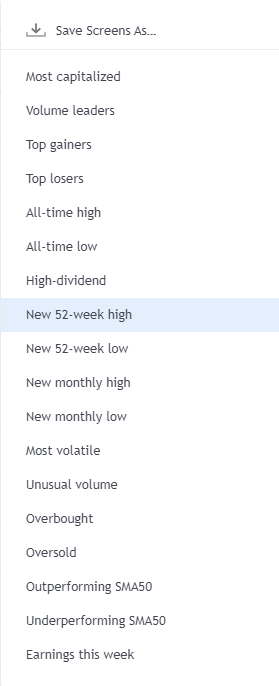
tradingview stock screener screens

Most capitalized

The most capitalized screener will show you the stocks with the highest market capitalizations.

Volume leaders

The volume leaders will populate stocks with the highest trading volume for a particular day.

Top gainers

The top gainers screener will show you the stocks increasing the most that day.

Top losers

The top losers screener will show the stocks decreasing the most that day.

All-time high

The all-time high screener will find stocks that recently hit their all-time high.

All-time low

The all-time low screener will find stocks that are hitting their all-time lows.

High-dividend

The high-dividend screener will find stocks that pay the highest dividend yields.

New 52-week high

The new 52-week high screener finds stocks hitting their highest price of the last 52 weeks (year).

New 52-week low

The new 52-week low screener finds stocks hitting their lowest price in the last 52 weeks (year).

New monthly high

The new monthly high screener finds stocks hitting their high of the month.

New monthly low

The new monthly low screener finds stocks hitting their low of the month.

Most volatile

The most volatile screener finds stocks that fluctuate the most in either direction.

Unusual volume

The unusual volume screener finds stocks that have more volume than usual.

Overbought

The overbought screener finds stocks that are technically overbought (overpriced) based on various metrics.

Oversold

The oversold screener finds oversold (discounted) stocks based on various metrics.

Outperforming SMA50

This screener finds stocks above their 50-day moving average.

Underperforming SMA50

This screener finds stocks trading below their 50-day moving average.

Earnings this week

Discover stocks that have earnings in the current week using this screener.

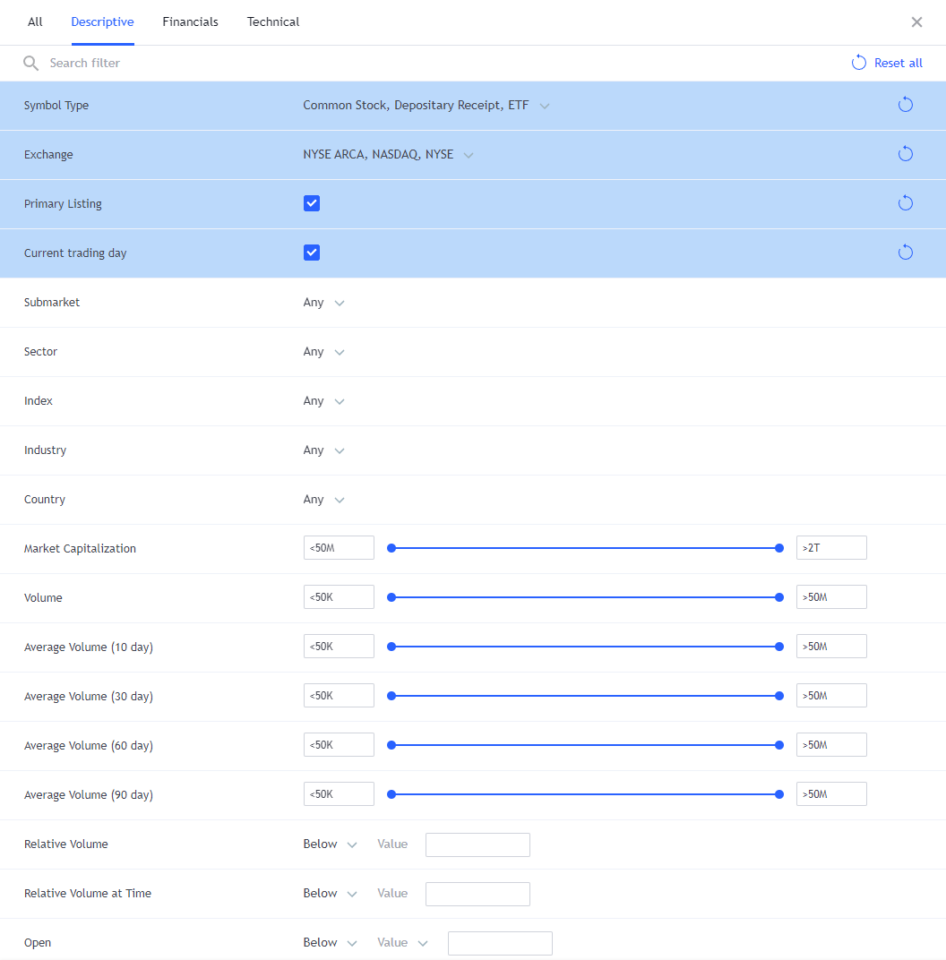
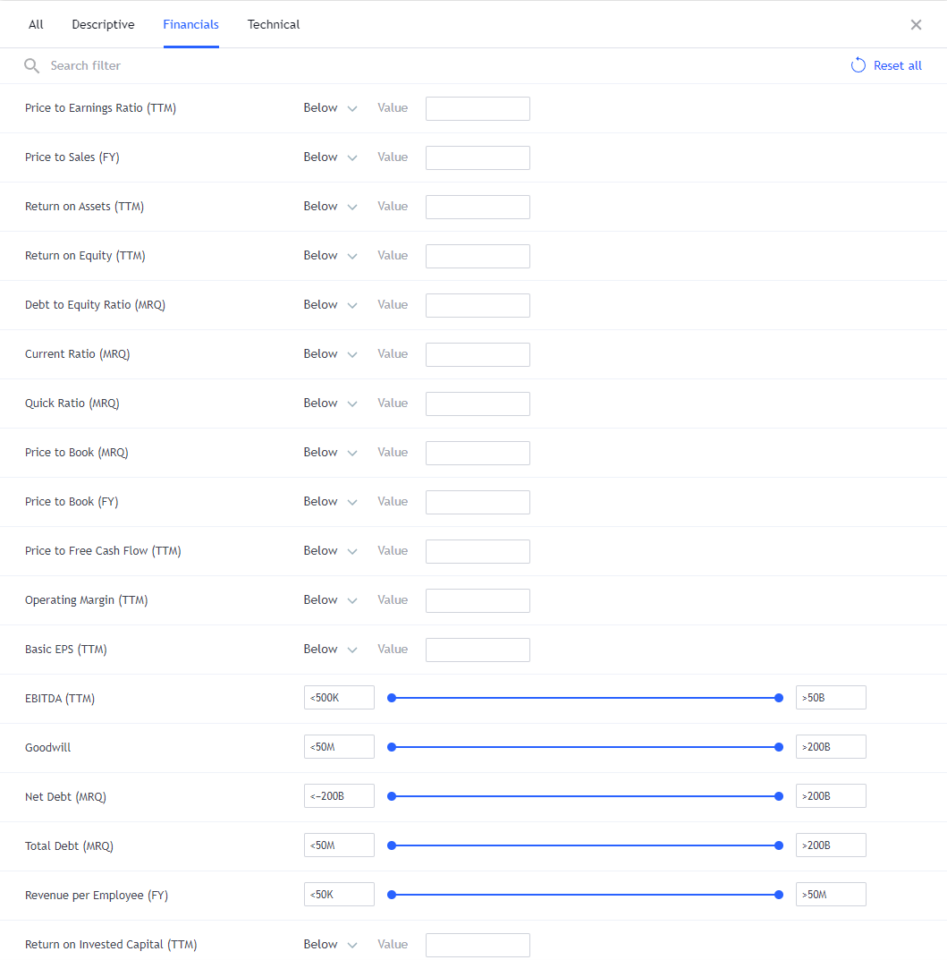
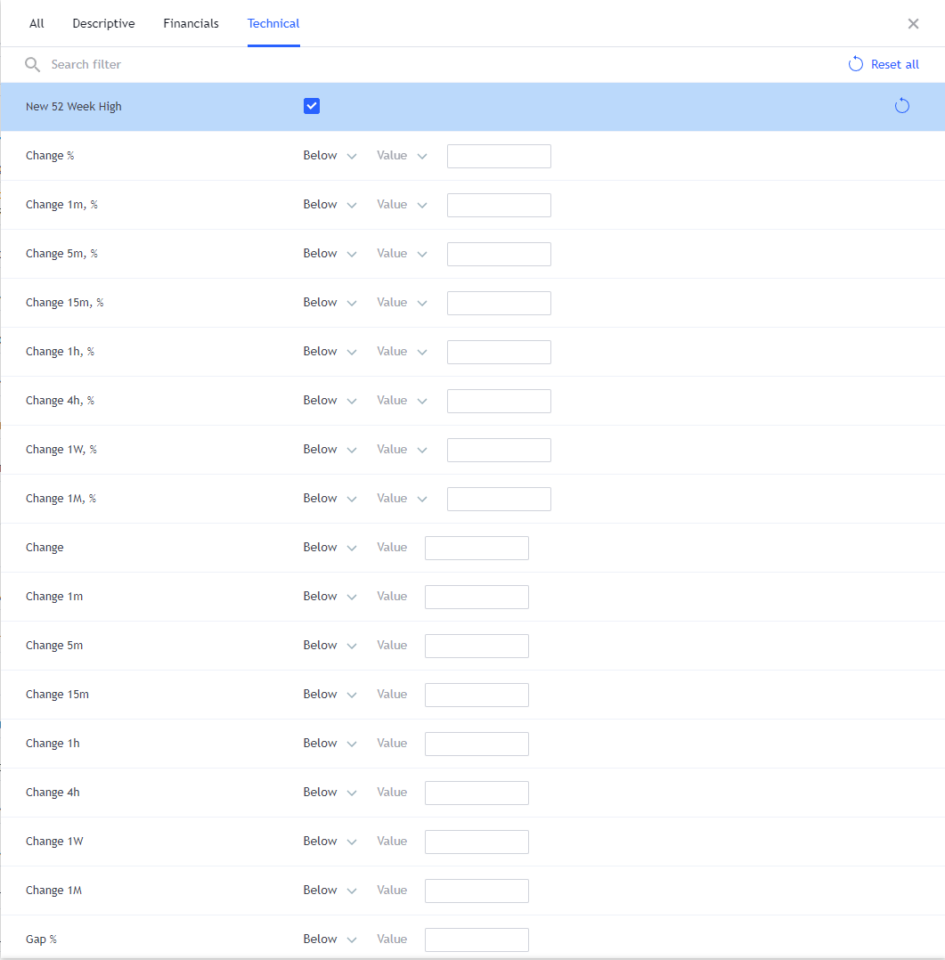
TradingView Stock Screener Filters

The filters allow you to filter out stocks that don’t meet certain criteria like the following:

Descriptive filters

Descriptive filters allow you to filter stocks by sector, index, country, and more.

tradingview stock screener descriptive

Financial filters

The financial filters allow you to filter out stocks based on fundamental data such as P/E ratios, price to book, current ratio, and more.

tradingview stock screener financials

Technical filters

The technical filters allow you to discover stocks with various percent changes, gap moves, relative strength indexes, and more.

tradingview stock screener technical

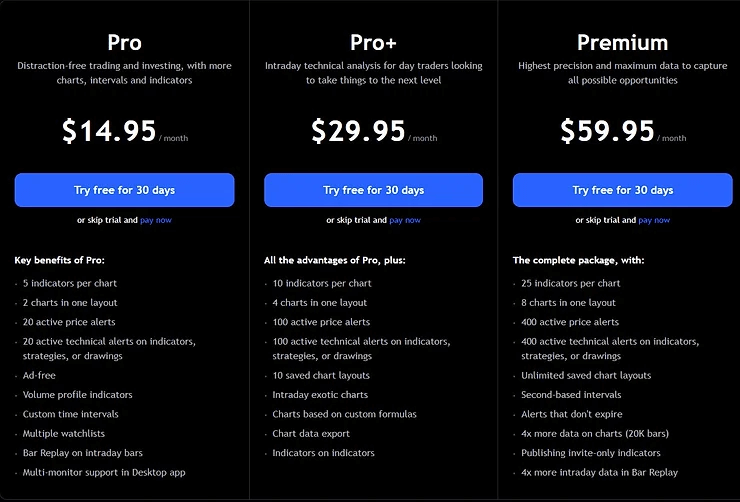
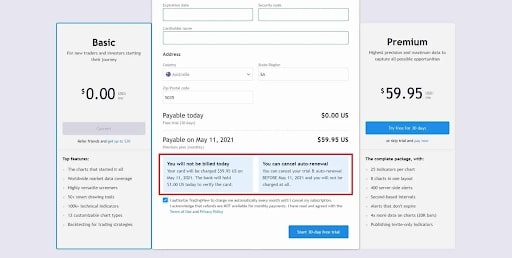
How Much Does TradingView Cost per Month?

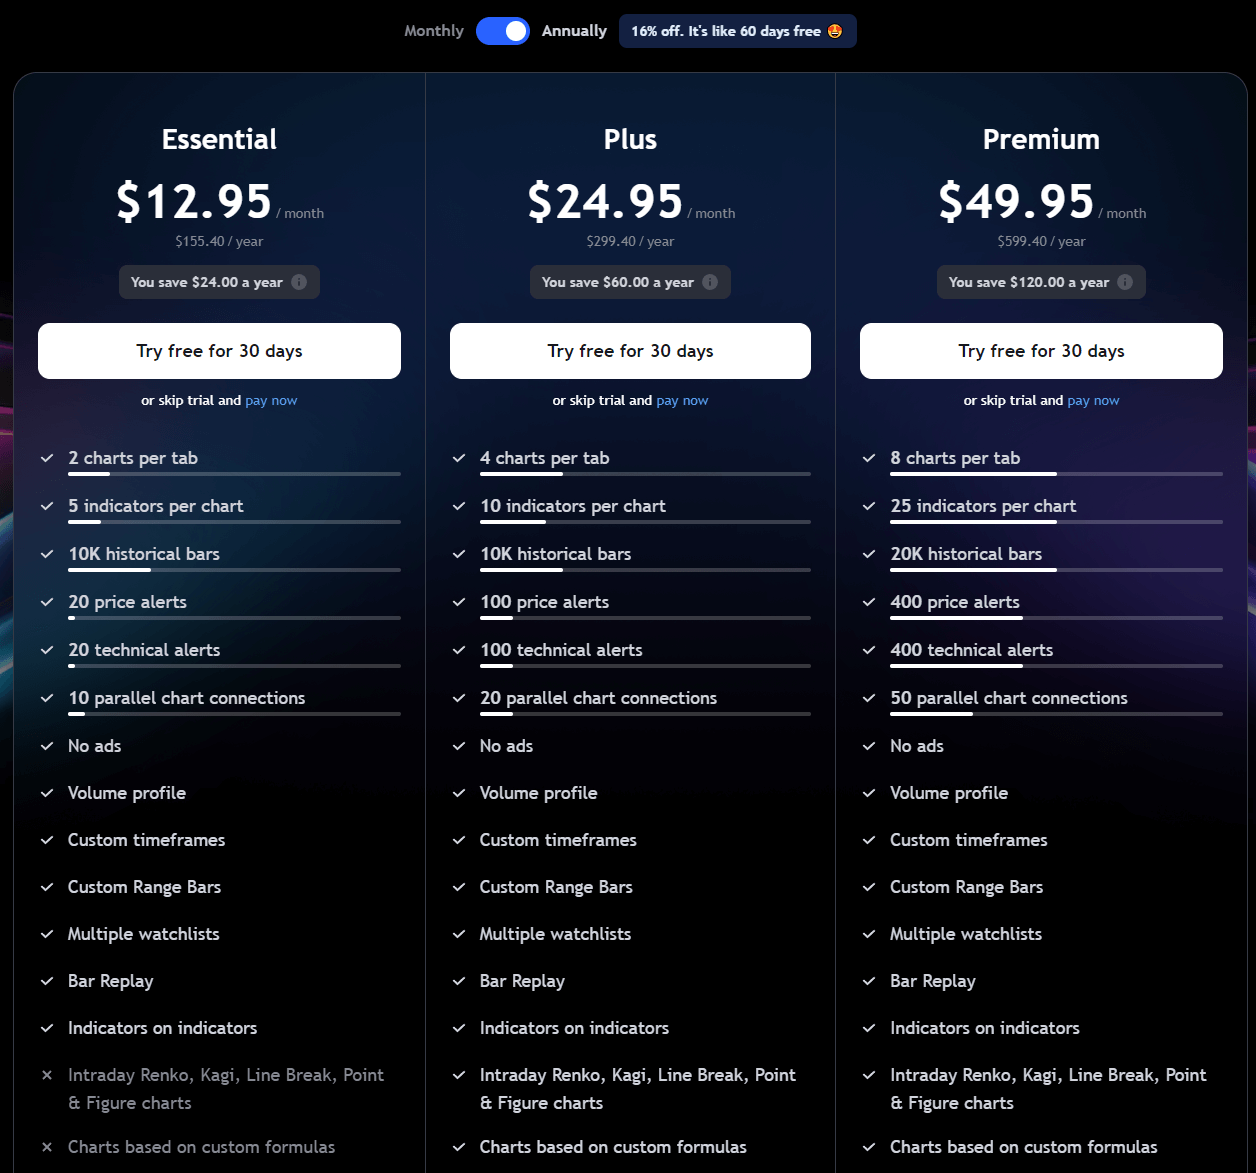
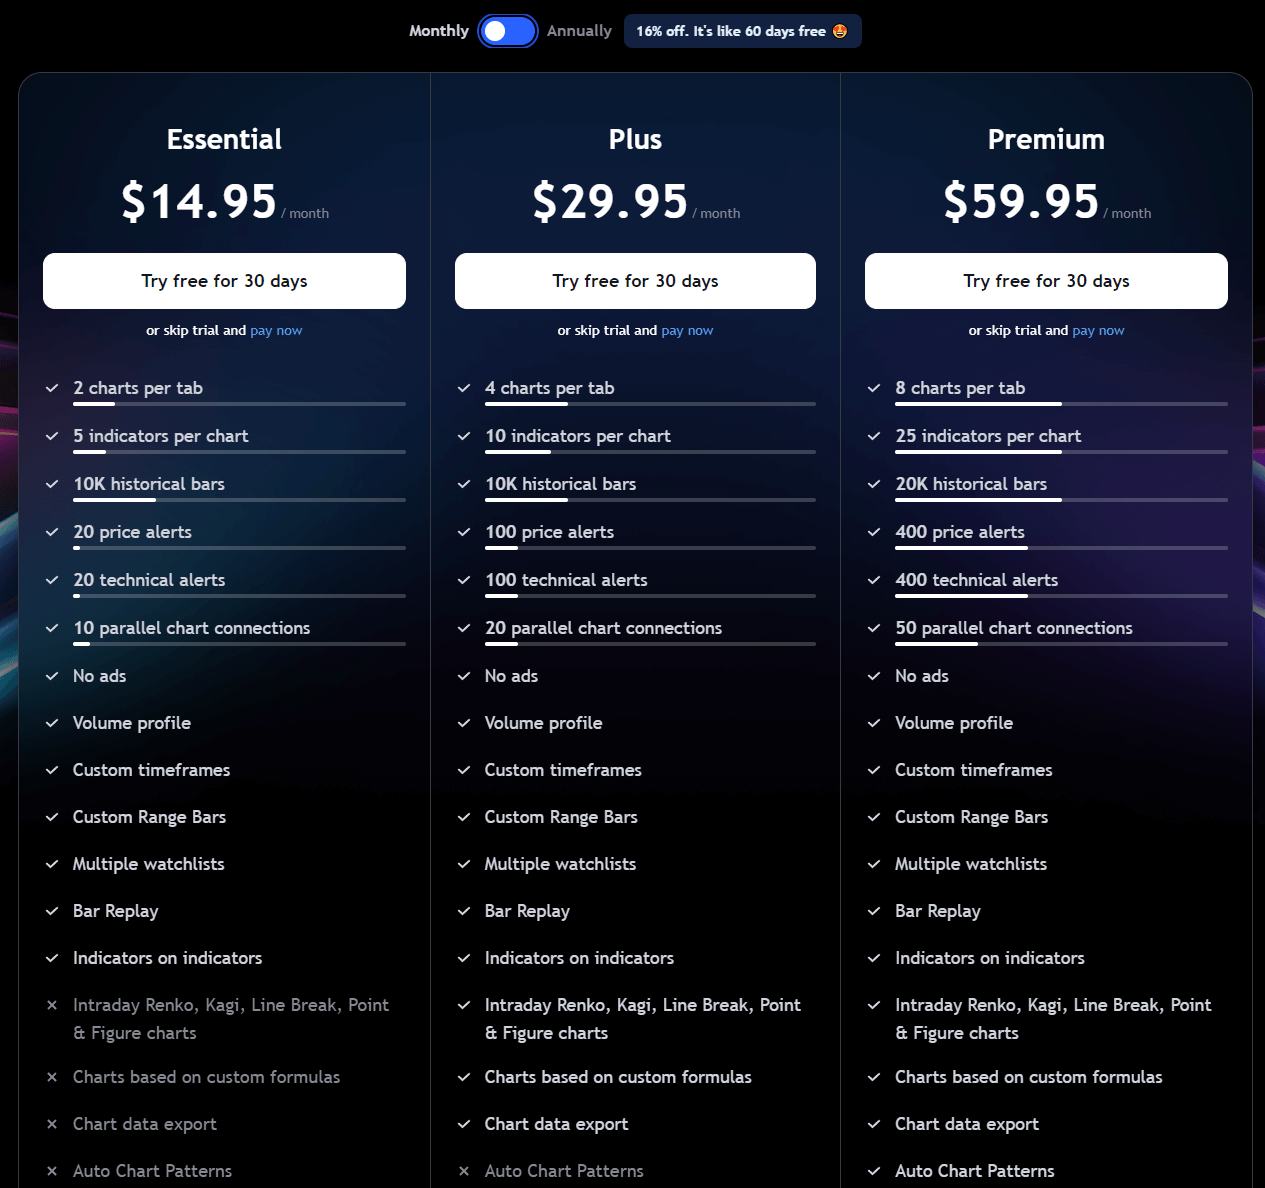
TradingView has several packages ranging from $12.95/ month ($14.95 billed monthly) to $49.95/ month ($59.95 billed monthly.

If you want to test out TradingView before purchasing a premium plan, new users can usually get a free TradingView free trial.

Before you go

If you want to keep educating yourself about personal finance, you must check out these posts as well:

What is the Most Successful Options Strategy

Options Trading for Income: The Complete Guide

Mark Minervini’s Trading Strategy: 8 Key Takeaways

The Best Options Trading Books

TradingView Pricing Guide

The Best Laptops and Computers for Trading

How to Get a TradingView Free Trial

The Best TradingView Indicators

The Best Keyboards For Trading

This article contains affiliate links I may be compensated for if you click them.

TradingView Real-Time Data | How to Access Real-Time Data on TradingView

tradingview real time data

While TradingView’s data for popular stocks and cryptocurrencies is nearly real-time for free users, paid users can buy more reliable real-time data directly from the exchanges.

If you only watch major stocks and ETFs like SPY, it is probably not necessary to purchase extra real-time data. However, if you like to actively trade several stocks, it may be worth it. Additionally, if you have real-time data through your broker, you may be able to connect it with TradingView to use its real-time data on TradingView.

You can watch the video I recorded that compares TradingView free data to thinkorswim’s real-time data so you can see first hand how delayed the TradingView free data really is. Continue reading to learn more about real-time data on TradingView.

How do I get real-time data on TradingView?

By default, TradingView offers real-time data for free wherever they can for stocks, forex, cryptocurrencies, and more. However, it’s important to note that the data available for free users may be delayed depending on the exchange and the instrument being viewed.

For instance, data for some assets could be delayed by up to 15 minutes, but on most popular stocks, it is pretty close to real-time in my experience.

Paid TradingView users can purchase real-time data directly from the exchanges by purchasing it from the market data page. It is important to note that free users are unable to purchase real-time data, but you can get a TradingView free frial to unlock the ability to purchase real-time data free for 30 days.

TradingView Limited Time Offer!

Exclusive Deal: 30-Day FREE Premium Access + Bonus Credit

Don’t Miss Out – Sign up for TradingView Now!

  • Advanced Charts
  • Real-Time Data
  • Track all Markets
CLAIM YOUR FREE TRIAL

How do I get real-time data from exchanges I purchased with my broker?

To access real-time data on TradingView, you can link your existing brokerage account with the platform. Doing so lets you use the real-time data from the exchanges you have already purchased with your broker.

To link your account, navigate to the Trading Panel on TradingView and connect your broker. You can read more about accessing real-time data through your broker on TradingView’s support article.

Purchasing real-time data subscriptions from TradingView

If you don’t have an existing brokerage account or want additional real-time data, you can purchase data subscriptions directly from the exchanges through TradingView. They offer a range of data packages tailored to suit various needs, from individual stocks and forex pairs to entire exchanges.

To purchase a data subscription, visit the TradingView website, and go to the go pro page to view the various types of real-time market data you can purchase.

How Much Does TradingView Real-Time Data Cost?

TradingView real-time data subscriptions range from $2-$10 per month depending on which markets you are interested in. A popular choice is the US Stock Markets Bundle that includes all of the major U.S. stock exchanges for $9.95 per month. You can also buy each exchange individually for just a few bucks per month. Consider reading my TradingView pricing article to learn more.

tradingview real time data plans

Can I get a TradingView free trial?

Yes, new users can usually get a TradingView free trial to access its premium subscription plans. The trial typically lasts 30 days and provides access to various additional features and tools that are not available to free users.

The importance of real-time data

In the fast-paced world of trading, every second counts. Having access to real-time data is crucial for making timely decisions, as it allows traders and investors to react to market fluctuations and identify emerging trends as they happen.

If you are an active trader, it is simply not possible to trade on delayed data. You will be trading in the past, and your indicators won’t be updated.

How much is TradingView data delayed?

For free users on TradingView, data delays vary depending on the exchange and the instrument being viewed. Some stock exchanges, for example, may have data delayed by up to 15 minutes.

However, data for most markets markets is usually real-time. Popular and liquid stocks like SPY are also nearly real-time even for free users. However, it’s essential to be aware of potential delays when making trading decisions based on TradingView charts.

In the video below, I recorded live charts to compare TradingView’s free data to a real-time data source on thinkorswim. By watching this video, you will notice that the SPY data is pretty much real-time even without paying, but for other stocks, it may be slightly more delayed.

The primary difference between free and paid data subscriptions on TradingView lies in the availability of real-time data. While free users may experience delays for certain exchanges and instruments, paid users with data subscriptions have access to real-time data, ensuring their charts are reflecting the current market prices.

Does TradingView have live futures data?

Yes, TradingView does provide live futures data. The platform offers data on various futures contracts, including those related to commodities, indices, and other financial instruments.

To access live futures data on TradingView, users must have a data subscription for the specific futures market they’re interested in. Once subscribed, you can view real-time futures data by entering the appropriate futures contract symbol in the search bar or browsing the platform’s futures market section.

Is TradingView OTC data real-time?

TradingView does offer real-time OTC data for some markets. However, the availability of real-time data may depend on the specific OTC market and whether you have a data subscription for that particular market.

To access real-time OTC data on TradingView, you’ll need to purchase a data subscription for the OTC market you’re interested in. Once subscribed, you can access real-time OTC data by searching for the relevant instrument symbol or browsing the platform’s OTC market section.

FAQs

Q: Does TradingView provide real-time data?

  • A: Yes, TradingView offers real-time data on its platform for various financial markets, including stocks, cryptocurrencies, forex, and more. Real-time data allows traders and investors to access up-to-the-minute information, including price quotes, volume, and market depth.

Q: How can I access real-time data on TradingView?

Q: Are there any additional fees to access real-time data on TradingView?

  • A: While TradingView provides real-time data for certain markets as part of its upgraded plans, it’s important to note that some exchanges may require separate subscriptions or fees to access their real-time data. TradingView offers the ability to add extra real-time and intraday data for exchanges such as NASDAQ, NYSE, OTC, and more. These additional data subscriptions may involve extra charges depending on the exchange.

Q: How reliable is the real-time data on TradingView?

  • A: TradingView strives to provide reliable real-time data, but it’s essential to understand that the accuracy and reliability of data may be influenced by factors beyond TradingView’s control. Factors such as exchange latency, internet connectivity, and data provider accuracy can impact the reliability of real-time data. It’s advisable to cross-reference data from multiple reputable sources and consider the potential for delays or discrepancies.

Q: Can I see after-hours data on TradingView?

  • A: Yes, TradingView allows users to access after-hours data for supported markets. After-hours trading refers to the extended trading hours beyond regular market hours. During this time, you can view price movements, volume, and other relevant information for stocks and other instruments traded outside of normal market hours.

Q: Is TradingView’s real-time data worth it?

  • A: The value of TradingView’s real-time data depends on individual trading needs and preferences. Real-time data enables traders to stay updated with the latest market movements, make timely decisions, and execute trades more effectively. It can be particularly useful for active day traders and short-term traders who rely on up-to-the-minute information. Assess your trading style, strategies, and goals to determine if the benefits of real-time data align with your requirements.

Q: Can I extract live data from TradingView for analysis or automation purposes?

  • A: TradingView provides an API (Application Programming Interface) that allows developers and advanced users to access live data and build custom applications, perform data analysis, and automate trading strategies. The TradingView API offers various endpoints and functionalities to interact with real-time and historical data, empowering users to create their own trading tools and systems.

Before you go

If you want to keep educating yourself about trading and personal finance, you must check out these posts as well:

What is the Most Successful Options Strategy

Options Trading for Income: The Complete Guide

Mark Minervini’s Trading Strategy: 8 Key Takeaways

The Best Options Trading Books

TradingView Pricing Guide

The Best Laptops and Computers for Trading

The Best Monitors for Trading

How to Get a TradingView Free Trial

The Best TradingView Indicators

The Best Keyboards For Trading

TrendSpider vs. TradingView

TrendSpider Free Trial

TrendSpider Discount Code

This article contains affiliate links I may be compensated for if you click them.

TradingView Pricing & Plans Comparison in 2024

tradingview pricing and plans comparison

TradingView is one of the most popular charting software which you can use entirely for free. However, a premium TradingView plan will give you access to advanced features like real-time data, multiple charts on one layout, market profile charts, footprint charts, and volume profile indicators. Continue reading to discover a complete TradingView plan comparison to help you determine which is right for you.

TradingView Pricing Key Takeaways

  • TradingView has several plans available starting at just $12.95 per month when you pay annually.
  • TradingView operates on a freemium model, meaning it is 100% free to use, but you can upgrade for more advanced features.
  • Occasionally, TradingView runs sales which may lower the price even further.
  • When you sign up for TradingView using my affiliate link, you can get a free trial and a $15 referral credit.

TradingView Essential
14.95 per month
12.95 billed annually
  • Charts per layout: 2
  • Indicators per chart: 5
  • Saved chart layouts: 5
Free Trial
TradingView Plus
29.95 per month
24.95 billed annually
  • Charts per layout: 4
  • Indicators per chart: 10
  • Saved chart layouts: 10
Free Trial
TradingView Premium
59.95 per month
49.95 billed annually
  • Charts per layout: 8
  • Indicators per chart: 25
  • Saved chart layouts: ∞
Free Trial

TradingView Pricing Examined

TradingView prices are structured with four subscription plans: Free, Essential, Plus, and Premium. If you pay monthly, the prices range from $14.95 to $59.95 per month. You can also pay annually for a discount and get TradingView as low as $12.95 per month.

As you move up the tiers, you gain access to more advanced tools, additional chart layouts, access to real-time data, and more.You can purchase real-time data for an additional monthly charge ranging from $2-$10 per month, depending on which data you choose.

TradingView Plans Pricing Comparison

Plan Monthly Price Annual Price Per Month (Total Price) % Savings Annually
Essential Free Trial $14.95 $12.95 ($155.40) 13.38%
Plus Free Trial $29.95 $24.95 ($299.40) 16.69%
Premium Free Trial $59.95 $49.95 ($599.40) 16.69%

If you want to try the premium subscriptions for free, new users can usually get a TradingView 30-day free trial.

TradingView Annual Pricing

Choosing an annual subscription to TradingView, you’ll find the Essential plan at $155.40, Plus at $299.40, and Premium at $599.40. Choosing the annual payment plan allows you to enjoy savings of up to 16.69% over the monthly payment option.

Essential plan ($12.95/ month billed annually)

Plus plan ($24.95/ month billed annually)

Premium plan ($49.95/ month billed annually)

TradingView Monthly Pricing

Opting for a monthly subscription plan, TradingView offers its Essential plan at $14.95, Plus at $29.95, and the Premium experience at $59.95 per month.

TradingView Essential Plan ($14.95/ month billed monthly)

TradingView Plus Plan ($29.95/ month billed monthly)

TradingView Premium ($59.95/ month billed monthly)

TradingView Plans Comparison

PlanPrice per monthCharts per layoutIndicators per chartSaved chart layouts
Essential$14.95255
Plus$24.9541010
Premium$49.95825unlimited

TradingView Real-Time Data Pricing

While TradingView provides real-time data whenever possible, more accurate real-time data can be purchased on any paid account directly from sources such as the CME Group, Nasdaq, and the NYSE. Here is a table comparing the TradingView real-time data cost for all of the avaialble data sources:

Data SourceReal-Time Data Cost Per Month
US Stock Markets bundle
NYSE, NASDAQ, NYSE Arca, NASDAQ GIDS, OTC
$9.95
NASDAQ Stock Market$3.00
NASDAQ Global Index Data Service
GIDS
$5.00
New York Stock Exchange
NYSE
$3.00
NYSE Arca$3.00
OTC Markets$3.00
CME Group (E-mini Included)
CME, CBOT, COMEX, NYMEX
$7.00
Bursa Malaysia Berhad
MYX
$2.00
Stock Exchange of Thailand
SET
$2.00
Tokyo Stock Exchange
TSE
$3.00
Borsa Instanbul (no volume data)$1-$8

TradingView Plan Details

Premium Plan

The Premium plan is TradingView’s most comprehensive offering, designed for highly active traders and investors who require an extensive toolset and top-notch service. Some notable features and benefits of the Premium plan include:

  • 25 indicators per chart: Enhance your technical analysis with more simultaneous indicators.
  • 8 charts in one layout: Efficiently analyze multiple markets and timeframes simultaneously.
  • 400 active price alerts: Receive real-time notifications for significant price movements and technical indicator changes.
  • Volume footprint charts: view how much volume is traded by price for each candle.
  • TPO charts (market profile): Access TPO charts which is an advanced tool for day traders.
  • Unlimited saved chart layouts: Save and access as many chart layouts as needed for easy reference and analysis.
  • Second-based intervals: Utilize granular timeframes for precise market analysis.
  • Alerts that don’t expire: Receive continuous alerts without the need to renew them.
  • 4x more data on charts (20K bars): Access a greater range of historical data for backtesting and analysis.
  • Publishing invite-only indicators: Share exclusive indicators with a select audience.
  • 4x more intraday data in Bar Replay: Improve your backtesting capabilities with a larger range of intraday data.

Plus Plan

The Plus plan is designed for experienced traders who need advanced charting and analysis capabilities. Some notable features and benefits of the Plus plan include:

  • 10 indicators per chart: Enhance your technical analysis with a wider range of simultaneous indicators.
  • 4 charts in one layout: Efficiently analyze multiple markets and timeframes in one view.
  • 100 active server-side alerts: Receive more real-time notifications for key market events.
  • 10 saved chart layouts: Save and access multiple chart layouts for various trading strategies and instruments.
  • Intraday exotic charts: Utilize advanced chart types like Renko, Kagi, Line Break, and Point & Figure for deeper market insights.
  • Charts based on custom formulas: Create personalized charts using custom calculations and expressions.
  • Chart data export: Export chart data for further analysis in external tools.
  • Indicators on indicators: Apply technical indicators to other indicators for more sophisticated analysis.

Essential Plan

The Essential plan offers a solid balance of advanced features and affordability, catering to traders who need more powerful tools than the Free plan but may not require the full range of features provided by the Premium plan. Some key features and benefits of the Essential plan include:

  • 5 indicators per chart: Access a variety of technical indicators for more in-depth analysis.
  • 2 charts in one layout: Compare different markets and timeframes within a single view.
  • 20 active server-side alerts: Stay informed of important market events without overloading your browser.
  • Ad-free: Enjoy an uninterrupted trading experience without ads.
  • Volume profile indicators: Analyze market liquidity and trading activity with volume profile tools.
  • Custom time intervals: Create unique timeframes for a more tailored trading experience.
  • Multiple watchlists: Organize and monitor various financial instruments with ease.
  • Bar Replay on intraday bars: Test your trading strategies with intraday Bar Replay.
  • Multi-monitor support in the Desktop app: Expand your trading workspace with support for multiple monitors.

Get a TradingView Discount and Free Trial

To get a $15 credit toward your premium TradingView plan, you can use my TradingView affiliate link to sign up! This link will only work for new accounts, so if you already have one, consider deleting it and making a new one to receive your bonus.

TradingView Limited Time Offer!

Exclusive Deal: 30-Day FREE Premium Access + Bonus Credit

Don’t Miss Out – Sign up for TradingView Now!

  • Advanced Charts
  • Real-Time Data
  • Track all Markets
CLAIM YOUR FREE TRIAL

FAQ

Is it worth paying for TradingView?

If you are an active trader constantly monitoring the markets, having access to a charting platform is crucial. However, other charting platforms, such as thinkorswim, are free if you have a funded account with TD Ameritrade or Schwab.

Can I use TradingView for free?

Yes, TradingVIew offers a free plan, and new users can usually get a 30-day free trial of the paid plans.

What is the cheapest TradingView price?

The cheapest plan for TradingView is the Essential plan which costs $12.95 billed annually.

Is TradingView better than ThinkorSwim?

ThinkorSwim is a well-known charting platform, but it requires a funded account with TD Ameritrade. If you have a funded TD Ameritrade account, you can use ThinkorSwim for free, making it a great value.

However, if you don’t have a broker with advanced charting tools, TradingView is universal, and you can use it on any desktop browser.

Related Posts

TradingView Discount Code

Trendspider vs. TradingView

TrendSpider Free Trial

TrendSpider Discount Code

Disclaimer: Financial Tech Wiz is an affiliate of TradingView and will be compensated if you use our affiliate link to buy a TradingView subscription.

TradingView Multiple Charts Setup Guide

tradingview multiple charts

TradingView allows you to use up to 16 charts per layout so you can view multiple assets and timeframes on one screen. Continue reading to learn how to use the multiple charts feature.

Key Takeaways

  • TradingView allows you to use multiple charts per layout with a paid plan.
  • You can use 2 charts on the Essential plan, 4 on the Plus plan, and 8 on the Premium plan.
  • TradingView offers professional plans that allow up to 16 charts per layout.
  • You can use multiple charts on TradingView for free by opening TradingView in multiple browser tabs.

TradingView Limited Time Offer!

Exclusive Deal: 30-Day FREE Premium Access + Bonus Credit

Don’t Miss Out – Sign up for TradingView Now!

  • Advanced Charts
  • Real-Time Data
  • Track all Markets
CLAIM YOUR FREE TRIAL

How to Add Multiple Charts in TradingView

1. Navigate to the TradingView top bar menu and find the ‘Select layout’ icon.

tradingview multiple charts 1

2. In the dropdown menu, select the chart layout composition of your choice. Note that different subscriptions may have different layouts unlocked.

tradingview multiple charts 2

How to Use Tradingview Multiple Charts for Free

You can use multiple charts on TradingView without buying a paid subscription by opening TradingView in multiple browser windows. Once you have multiple instances of TradingView opened, simply resize each instance of your browser to be smaller so you can fit multiple on one screen.

As you can see in this image, I simply have four different windows resized so four windows are visible on one of my trading monitors. While this isn’t as good as using the paid version, it works if you really do not want to upgrade.

tradingview multiple charts for free using multiple browser windows

For comparison, this image shows how much better four charts on one layout looks when using a paid subscription.

tradingview 4 charts in one layout

Types of TradingView Multiple Charts Layouts

Here are all the chart layouts that TradingView currently offers. Users with the Essential plan have layout 1&2 unlocked. Users with the Plus plan have additional layouts 3&4 unlocked along with the Essential plan layouts. Users with a Premium plan have all the way up to 8 charts per layout unlocked. You can also upgrade to a professional plan to get up to 16 charts in a single layout.

tradingview multiple chart types

How to Save TradingView Multiple Charts Layouts

After building your multiple chart layout, you must save it to retain your charts for future use.

To save a TradingView layout, follow these step-by-step instructions:

1. Go to the chart interface top menu bar and select the ‘Manage layouts’dropdown menu.

tradingview multiple charts 4

2. In the dropdown menu, select ‘Save layout.’

tradingview multiple charts layout

3. You can also name your new layout by clicking rename.

tradingview multiple charts 6

Your new layout is now saved. To retrieve this layout: Go to the same drop down menu then click ‘Load Layout.’

In the ‘Load layout’ window, select the chart layout you want to load. Your selected layout will load immediately.

After you finalize your settings, non-professional can access up to 8 charts per layout, as seen below!

tradingview multiple charts

TradingView Multiple Charts – Bottom Line

The free plan does not allow using multiple charts, but fortunately, TradingView usually offers a free trial for new users for every one of their paid plans. You will also gain access to more technical indicators that free members do not get.

Alternatively, you can open multiple browser windows to use multiple charts on TradingView without paying for a premium subscription.

TradingView vs. Stockcharts | Which is Better?

stockcharts chart

Today we will take a look at TradingView and Stockcharts – two of the biggest charting platforms on the market today.

In this post, we discuss their key components and compare their upsides and downsides, and show you why they are two of the best charting software for stocks.

Platform Charts per Layout Backtesting Alerts Screeners Assets and Markets
TradingView Free Trial 2 (Essential), 4 (Plus), 8 (Premium) Yes 20 (Essential), 100 (Plus), 400 (Premium) Yes Stocks, Forex, Crypto, Futures, Options, Bonds, ETFs, CFDs, Indices, Commodities
StockCharts Visit site 1 (Basic), 25 (Extra, Pro) No 2 (Basic), 200 (Extra), 500 (Pro) Yes Stocks, ETFs, Mutual Funds, Indices

Interface and Chart Design

TradingView and Stockcharts both provide a modern-looking and intuitive interface.

TradingView offers a modern, smart, and highly intuitive interface alongside a dashboard that displays all relevant panels (Watchlist, News, Market Summary). TradingView also provides an incredible user-friendly charting experience powered by HTML 5.

tradingviewvsninjatrader
Tradingview Chart

On the other hand, StockCharts emphasizes expert market analysis and commentary, making it a valuable resource for those looking to learn from industry professionals.

In terms of customization, both platforms provide ample options for personalizing charts and indicators. However, TradingView has a slight edge with its Pine Script language, allowing users to create custom studies and strategies.

stockcharts chart
Stockcharts Chart

Pricing

TradingView is cheaper than Stockcharts, but both have a fairly wide selection of plans for customers to choose from suitable to their budget.

Platform Free Essential Plus Premium
TradingView Free Trial Yes $14.95/month $29.95/month $59.95/month
StockCharts Visit site Yes $19.95/month $29.95/month $49.95/month
This table now includes the information you provided about TradingView and StockCharts, with the same styling and structure as before. The left column remains sticky for mobile viewing, and the specified affiliate links and button text have been incorporated as requested.

TradingView Plans

TradingView offers three different annual subscription plans:

  • Essential – $12.95 per month (billed annually)
  • Plus – $24.95 per month (billed annually)
  • Premium – $49.95 per month (billed annually)

Monthly rates are also available for a slightly higher price:

  • Essential monthly: $14.95
  • Plus monthly: $29.95
  • Premium monthly: $59.95

TradingView Limited Time Offer!

Exclusive Deal: 30-Day FREE Premium Access + Bonus Credit

Don’t Miss Out – Sign up for TradingView Now!

  • Advanced Charts
  • Real-Time Data
  • Track all Markets
CLAIM YOUR FREE TRIAL

Stockcharts Plans

Stockcharts also offers four different subscription plans:

  • Free
  • Basic – $19.95 per month
  • Extra – $29.95 per month
  • PRO – $49.95 per month

stockcharts pricing
Stockcharts Plans

Real-Time Data Plans

TradingView and Stockcharts offer free BATS or CBOE real-time data for the US region but are delayed for all other exchanges.

TradingView also offers real-time data packages for global exchanges with upgraded plans for additional fees.

Stockcharts offers Official data plans for $9.95 per month for the US, UK, Canada, and India.

TradingView vs. Stockcharts | Pros and Cons

TradingView Pros

TradingView Cons

  • More expensive highest-tier subscription compared to Stockcharts

Stockcharts Pros

  • Easy setup
  • 30-day free trial

Stockcharts Cons

  • Doesn’t have a mobile app
  • Annotations require a paid subscription

Supported Markets and Instruments

TradingView and Stockcharts offer access to most markets and instruments. In addition, both platforms provide delayed data and access to official real-time data at an extra cost with their paid plans.

TradingView and StockCharts offer access to Forex, Stocks, Futures, and cryptocurrencies.

However, Stockcharts provides only free delayed end-of-day futures data.

Both platforms also offer free BATS data access. BATS (Better Alternative Trading System) is an exchange based in Kansas City that provides free unofficial real-time trading data.

This data is often very similar to official data, but traders should be aware that there can be differences (including significant volume differences). In addition, BATS data is only available for US stocks.

TradingView allows users to pay for US real-time data individually($2 per month each) instead of Stockcharts, which only offers this service as a bundle($9.95 per month).

Selection of Indicators

Both Stockcharts and TradingView offer the most well-known technical indicators.

Stockcharts provides 70+ built-in technical indicators, which is quiet enough for a casual user. However, TradingView offers astonishing 100+ built-in technical indicators with 5,000+ third-party custom indicators, which create an unforgettable user experience.

TradingView has a vast and ever-growing library of third-party indicators, strategies, and user-made scripts. Its native programming language Pine Script is well-known to be an easy-to-learn and lightweight scripting language.

Pine Script creates an opportunity for traders with no previous programming experience to create their own indicators and contribute to the TradingView library.

Is TradingView Good for Day Trading?

TradingView is an excellent platform for day trading, offering a wide array of features that cater to the needs of short-term traders. Its user-friendly interface, extensive collection of technical indicators, and customizable charting options make it easy for day traders to monitor the markets and make quick decisions.

TradingView’s social networking components also allow day traders to learn from and collaborate with others in real time. The Pine Script language further enhances the platform’s capabilities, enabling traders to create custom studies and strategies tailored to their specific trading style.

TradingView vs. Stockcharts | Bottom Line

TradingView and StockCharts are powerful charting platforms catering to different types of traders and investors. While TradingView excels in its user-friendly design, social features, and custom scripting capabilities, StockCharts offers a clean and focused charting experience with expert market analysis.

When choosing between these platforms, consider your trading needs, preferred features, and budget to determine the best fit for you. Ultimately, both platforms provide robust tools and resources to help you succeed in the markets.

You can now take advantage of our link that usually gives you a 30-day free trial of TradingView.

TradingView has something for everyone. Use my link and unlock the full potential of TradingView today! I’d consider my TradingView review article as part of your research.

Before you go

If you want to keep educating yourself about personal finance, you must check out these posts as well:

What is the Most Successful Options Strategy

Options Trading for Income: The Complete Guide

Mark Minervini’s Trading Strategy: 8 Key Takeaways

The Best Options Trading Books

TradingView Pricing Guide

The Best Laptops and Computers for Trading

The Best Monitors for Trading

How to Get a TradingView Free Trial

The Best TradingView Indicators

TradingView Free Trial Guide 2024

tradingviewfreetrialblog

TradingView is one of the best platforms providing charts currently available on the internet. Although you can still use it with absolutely zero issues for free, TradingView offers multiple subscription plans with countless different tools.

Does TradingView Have a Free Trial?

Yes, Tradingview offers free trials for its upgraded plans (Essential, Plus, and Premium). When you use my link, you will also get a discount on your subscription if you decide to continue after 30 days.

Tradingview usually offers free trials for its new platform users, although this is subject to change. The best way to find out if TradingView is currently offering free trials is to follow the instructions below or simply look at their website.

TradingView Limited Time Offer!

Exclusive Deal: 30-Day FREE Premium Access + Bonus Credit

Don’t Miss Out – Sign up for TradingView Now!

  • Advanced Charts
  • Real-Time Data
  • Track all Markets
CLAIM YOUR FREE TRIAL

How to Get a TradingView Free Trial

Trials aren’t accessible with existing plans or by users that are currently logged into an existing account.

If you want to create a new account, it’s important to note that TradingView has a strict policy around registering multiple accounts.

Therefore, if you already have an existing account, consider deleting it along with any old accounts.

Trialing the Essential, Plus, or Premium is hands down the best way to figure out what those features provide and which is best suited for you.

A free trial allows you to make a more informed decision before subscribing.

Also, if one particular plan suits you perfectly, I highly recommend taking the ‘Annual’ subscription option and taking advantage of discounts offered to annual subscribers.

Here are step-by-step instructions to get access to a TradingView free trial:

1. If you are a NEW TradingView user, skip to Step 2. If you already have a TradingView account. Make sure you’re signed out, and refer to the section above regarding multiple Accounts.

2. Go to the TradingView plans and upgrade page and see whether TradingView is currently offering trials. New users should be offered a free 30 days trial period for the Essential, Plus, or Premium plans.

3. Select the ‘Try free for 30 days’ subscription of your choice. You’ll need to select the Essential, Plus, or Premium plan to trial at this stage.

4. Signup with a NEW email

5. Complete the credit card or PayPal details (required for the free trial period). Take note of the auto-renewal date and trial hold amount.

6. Click ‘Start 30-day free trial, and that’s it! You may have to wait a few seconds but you will be directed to a TradingView chart.

7. You’re all set! Your free trial has started. You should now have access to all the features of your selected plan. Don’t forget to take note of the trial expiration date.

FAQs

Q: Does TradingView offer a free trial?

  • A: Yes, TradingView provides a free trial for its upgraded plans, including Essential, Plus, and Premium. This trial allows users to explore and experience the additional features and functionalities offered by these plans.

Q: How long is the free trial period?

  • A: The free trial period for TradingView’s upgraded plans is typically 30 days. During this time, users can access and utilize the advanced tools and features to enhance their trading and investing activities.

Q: Can I access all the features during the free trial?

  • A: Yes, during the free trial period, you will have full access to all the features and functionalities offered by the plan you choose. This allows you to explore and evaluate the upgraded plan thoroughly before making a decision.

Q: How can I start the free trial?

  • A: To start the free trial, you can visit the TradingView website and sign up for a free account. Once you have created your account, you can choose the plan you want to trial, and the free trial will be activated for the selected plan.

Q: Can I cancel my free trial before it ends?

  • A: Yes, you can cancel your free trial at any time before it expires. If you decide that the upgraded plan is not suitable for your needs, you can cancel the trial to avoid any future charges. However, it’s important to note that once the trial period ends and you choose to continue with the subscription, normal billing will apply.

Q: Are there any discounts available for TradingView’s upgraded plans?

  • A: TradingView occasionally offers discounts and promotions for its upgraded plans. You can use my link to get a discount on your membership as well.

Q: Can I switch plans during the free trial period?

  • A: Yes, you have the flexibility to switch between different plans during the free trial period. If you find that your initial choice of plan doesn’t meet your requirements, you can explore other plans and switch to the one that better aligns with your trading and investing needs.

Q: Is the TradingView free trial available worldwide?

  • A: Yes, the TradingView free trial is available to users worldwide. You can access the trial regardless of your location as long as you have an internet connection and meet the eligibility criteria.