TradingView is a powerful tool for traders and investors, but it can be a bit overwhelming at first. One of the most common questions we get is how to invert your chart on TradingView.
In this article, we’ll show you how to do just that.
Invert Your Chart Using the Gear Icon on Mac and Windows
One way to invert your TradingView chart is to click the gear icon on the bottom right of your chart.
After you click it, you can click Invert scale.
Invert Your TradingView Chart With a Keyboard Shortcut
If you’re using a Mac, you can use the keyboard shortcut ⌥ + I to invert your chart.
If you’re using Windows, use the keyboard shortcut Alt+I.
How to Invert a TradingView Mobile Chart (iPhone & Android)
To invert your TradingView mobile chart, click the gear icon at the bottom right of your chart.
Next, click invert scale.
Why Invert Your Chart?
Inverting your chart can be useful for a number of reasons. For example, if you’re trading stocks or other assets that are denominated in a foreign currency, inverting your chart can help you see how the asset is performing in your home currency.
Another reason to invert your chart is if you’re using technical analysis tools like moving averages or Bollinger Bands. These tools can be more effective when used on an inverted chart, and show you a different perspective.
Sign Up for TradingView
If you’re not already using TradingView, we highly recommend signing up for an account. TradingView is one of the best tools available for traders and investors, with several technical indicators, real-time data, and a cross-platform financial tool.
When you use our affiliate link, new users can usually get a free trial and a discount!
TradingView offers an array of tools and indicators designed to facilitate your trading experience. However, understanding how to manage these indicators is key to an organized and efficient trading experience.
Here’s a step-by-step guide on how to remove and manage indicators in TradingView.
How to Remove Indicators From a TradingView Chart
Removing indicators in TradingView is a straightforward process:
Click the arrow button under the symbol name to open the chart legend.
This will reveal a list of the indicators currently on your chart.
Hover your mouse over an indicator to display the management options:
The ‘X’ button removes the indicator.
The gear icon allows you to adjust its settings.
The eye icon enables you to hide the indicator.
Remember, if you’re uncertain of an indicator’s name, click on it directly on the chart. This action highlights its name in the menu, allowing you to identify it easily.
Customizing Indicator Settings
Alongside removing indicators, TradingView also lets you tweak their settings. Clicking on the gear icon opens various customization options, helping you tailor the indicator to your needs. For more information on indicators, check out our article on the Best TradingView Indicators.
How to Hide an Indicator on TradingView
Another feature for managing indicators is the ‘eye’ icon. Clicking this hides the chosen indicator from the chart without completely removing it, a handy tool for comparing scenarios with and without specific indicators.
Indicators and the Implied Volatility Chart
In addition to standard price charts, TradingView also offers an Implied Volatility (IV) chart. Used correctly, this tool, combined with your choice of indicators, can be a powerful strategy. Learn more about how to use indicators effectively with the IV chart in our TradingView Implied Volatility Chart post.
Wrapping Up: Streamline Your Trading Experience
Knowing how to manage your indicators on TradingView helps streamline your trading experience. It clears your workspace, optimizes your technical analysis, and, ultimately, supports better trading decisions.
We encourage you to apply the insights from this guide and take full advantage of TradingView’s robust functionalities. You should also check out how to remove layouts on TradingView.
Ready to elevate your trading journey? Sign up for TradingView using my affiliate link to get a discount on their premium subscription.
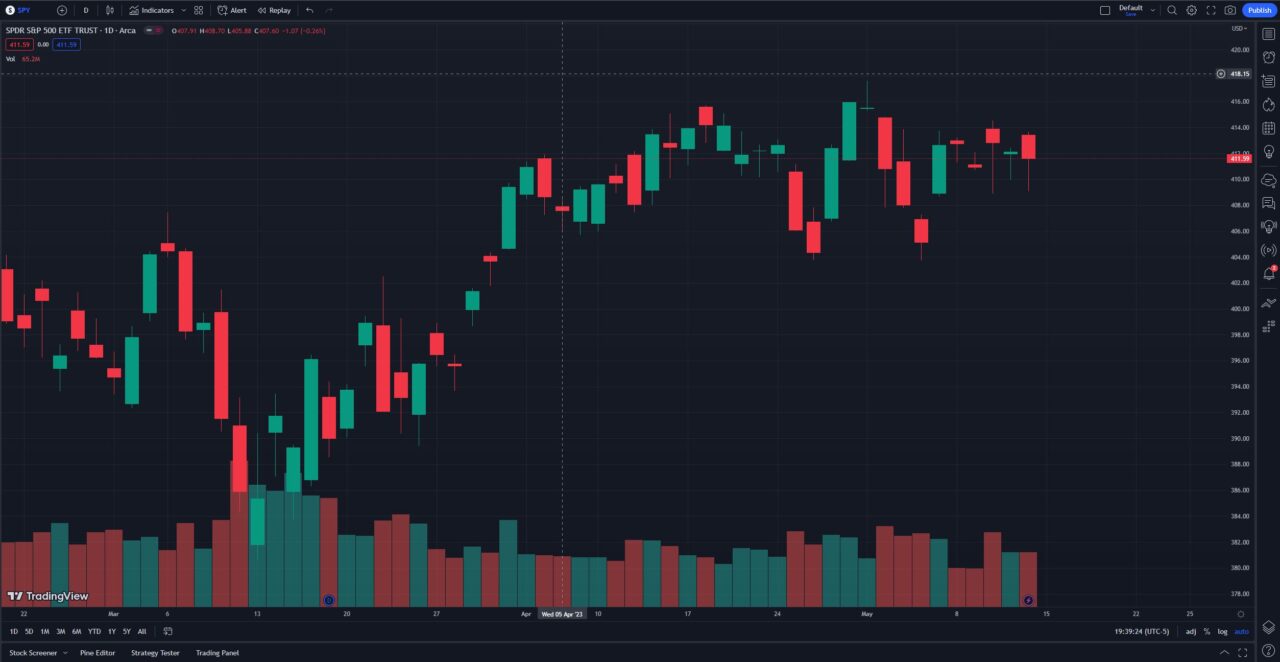
By default, TradingView does not show the volume bars at the bottom of the chart. This article will walk you through how to add and utilize the volume indicator in your TradingView charts.
How to Add Volume to Your TradingView Chart
Adding the volume indicator on TradingView is straightforward. Follow these steps:
Open TradingView and navigate to the chart of interest.
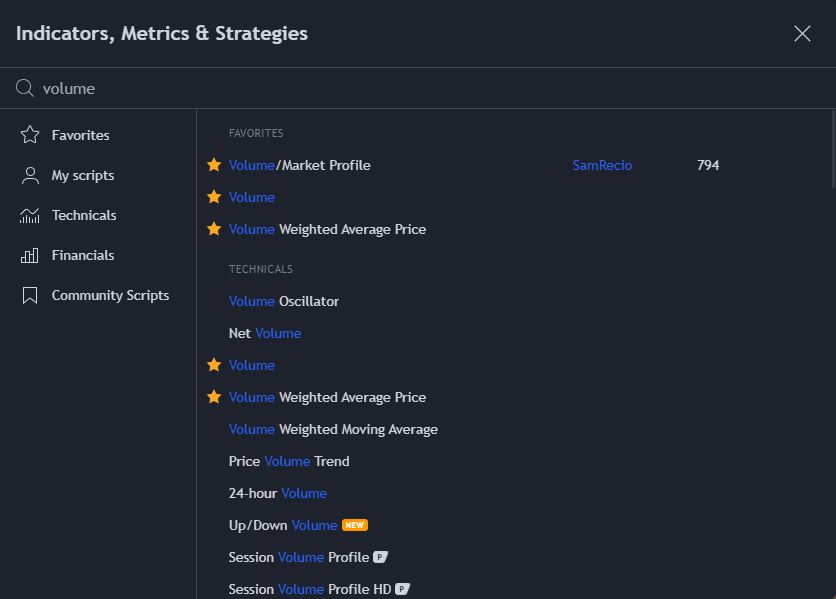
Click “Indicators” at the top left of the chart.
In the search bar within the indicators window, type “Volume.”
Click on the “Volume” indicator in the search results to select it.
The volume indicator will now be on your chart when you close the indicator window.
You can also watch my quick video about how to add volume in TradingView for a visual walkthrough below:
Trading volume plays a crucial role in understanding market trends. It measures the number of shares or contracts traded in a specific time period, providing insights into the intensity of a price movement. Dive deeper into the concept of trading volume to strengthen your trading strategies.
Why Volume Matters on TradingView
When you’re trading, you need every bit of information at your disposal. Volume gives you an insight into the strength or weakness of a price move.
High volume might indicate a strong move, while a price move on low volume could be less significant. Adding the volume indicator to your TradingView chart helps you gauge the buying and selling pressure in the market.
Strategies for Effective Volume Indicator Use
Once you’ve added the Volume Indicator, it’s important to utilize it effectively.
Understanding how volume relates to price moves can help inform your trading decisions. For example, a high volume surge on an upward price move could indicate a strong bullish sentiment.
While the Volume Indicator is a powerful tool, it’s not the only volume-based tool on TradingView. The Volume Profile, for instance, provides a more detailed view of trading activity at specific price levels.
How do I add volume to my TradingView Pine script?
Adding volume to your Pine script involves using built-in variables.
How do you use volume as an indicator?
Volume can be used to assess the strength or weakness of a price movement. For more, check out our post on how VWAP uses volume data.
What are the best volume indicators for TradingView?
There are many volume indicators available on TradingView, including the Volume Indicator, Volume Footprint Charts, and Volume Profile. The best one depends on your trading style and needs.
This article contains affiliate links I may be compensated for if you click them.
TradingView, a leading platform for real-time market data, charts, and community-driven predictions, is known for its robust features and user-friendly interface.
Activating dark mode is not just a modern aesthetic trend but also offers the benefit of reducing eye strain.
Unveiling TradingView Dark Mode
Dark Mode is a feature that allows you to change the appearance of your TradingView interface from a light to a dark theme. It’s not just about the looks – it’s about providing a comfortable and eye-friendly viewing environment. The best part?
This feature is readily available across all TradingView platforms – whether you’re using the website, the desktop app, or the mobile app.
Activating Dark Mode Across TradingView Platforms
Here’s how you can switch to Dark Mode on different TradingView platforms:
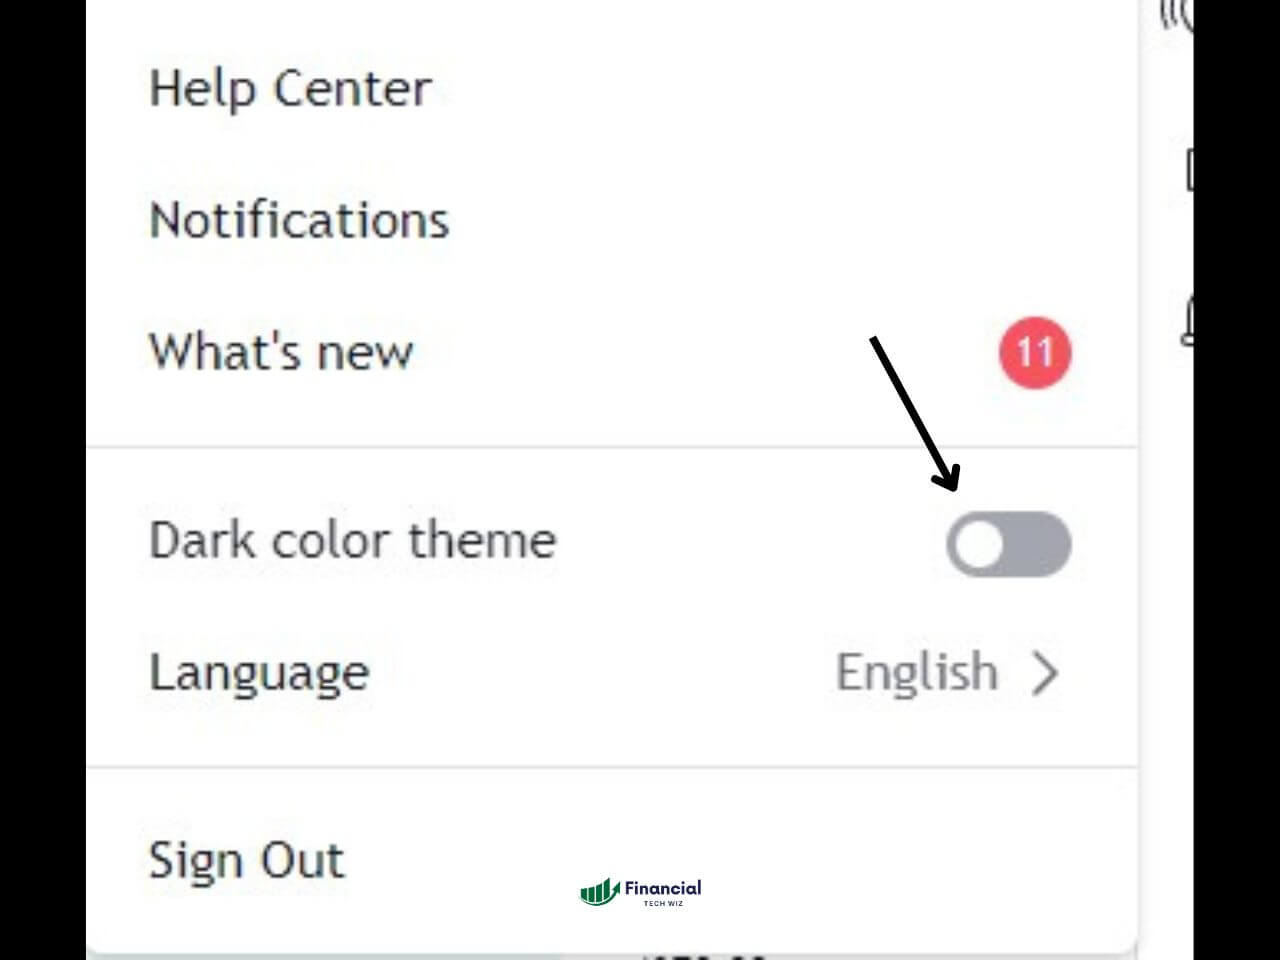
For TradingView Website
Go to the TradingView website.
Click on your profile picture in the top right corner.
Toggle the “dark color theme” option
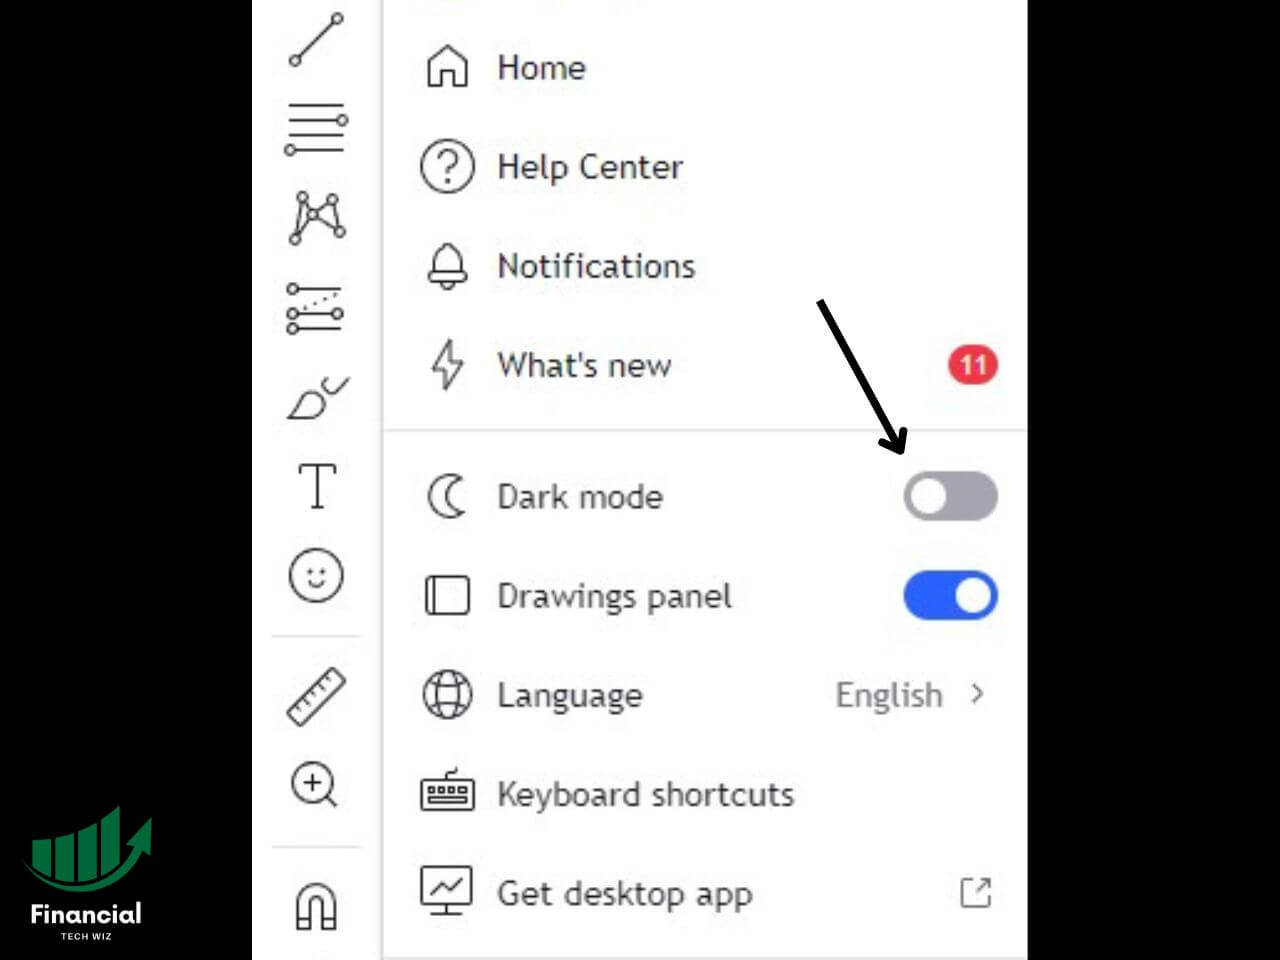
For TradingView Website When on a Chart
Open a chart on TradingView.
Click on your profile picture in the top left corner.
Toggle the dark mode option.
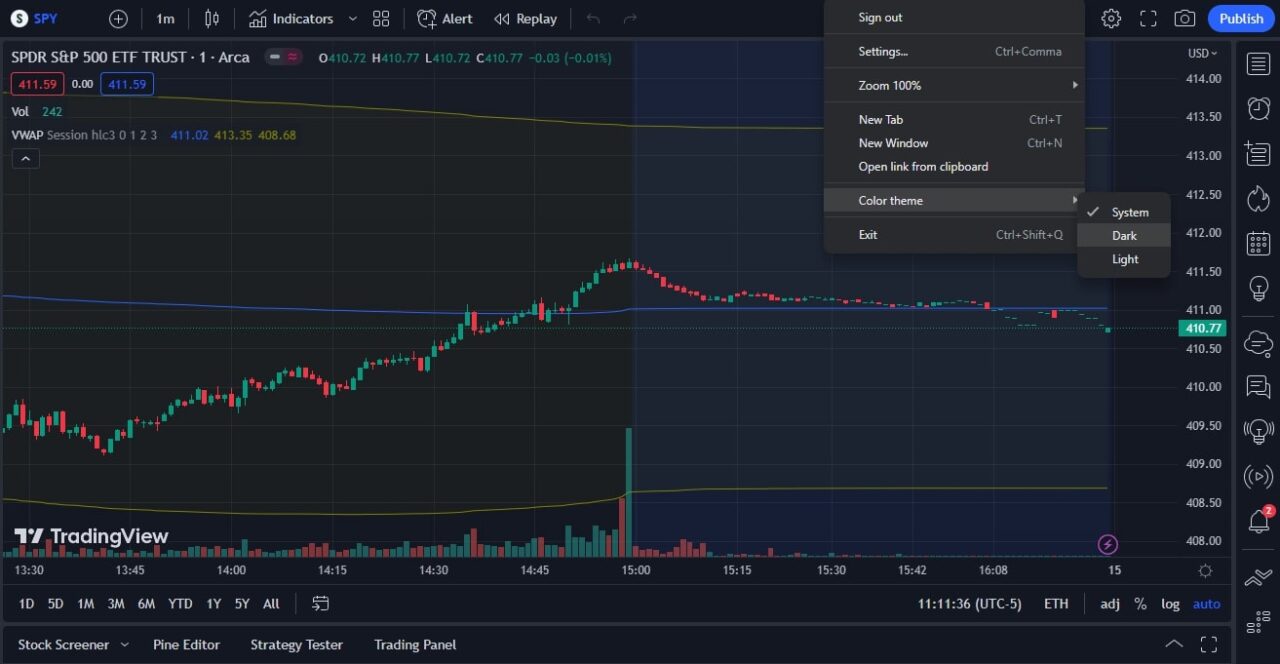
For TradingView Desktop App
Open the TradingView desktop app.
Click the three dots at the top right
Hover over “color theme.”
Select “Dark.”
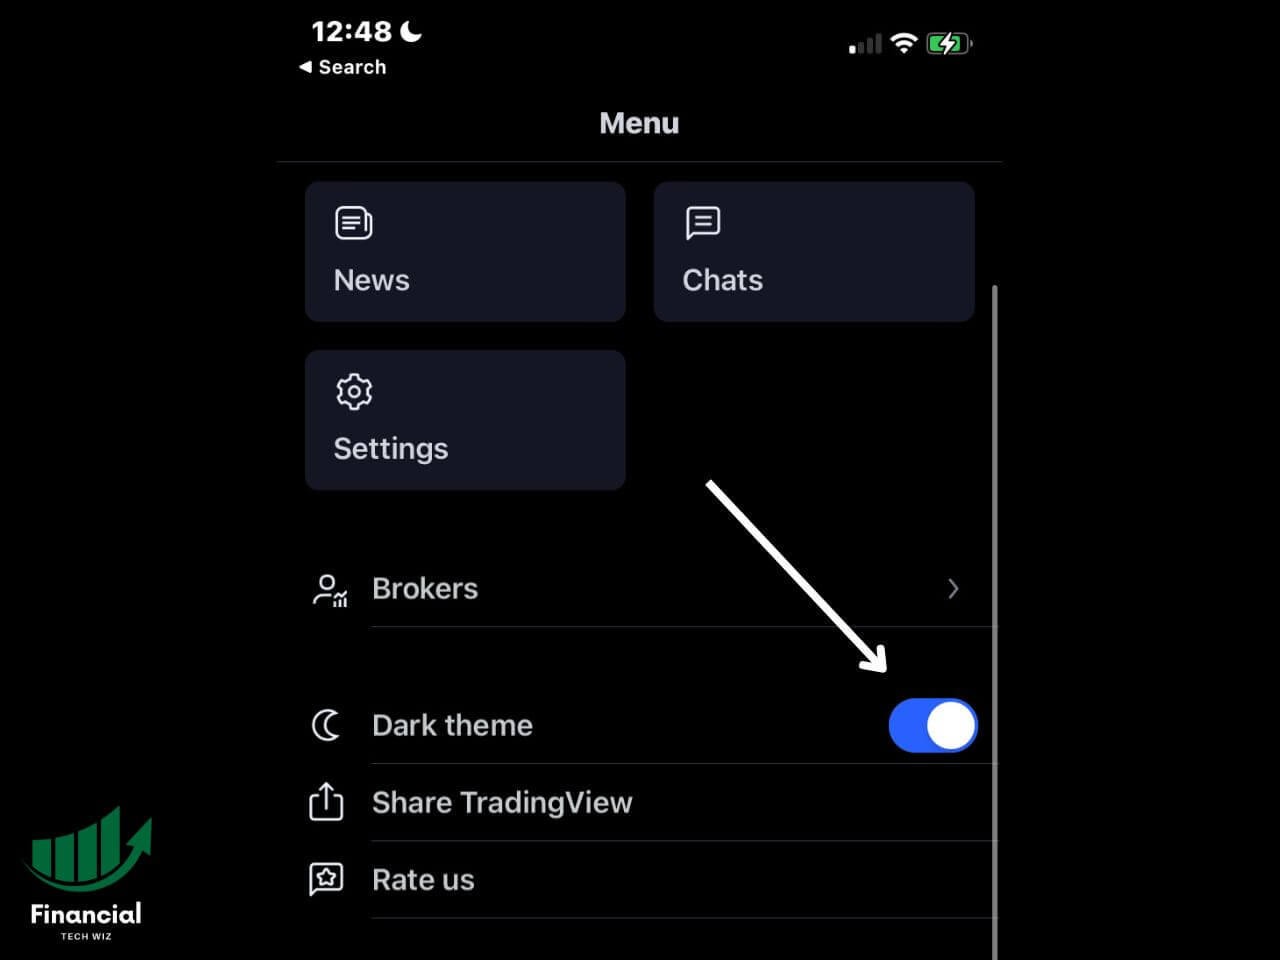
For TradingView Mobile App
Open the TradingView mobile app.
Tap the bottom right “Menu” button
Toggle “Dark Theme”
Why Switch to TradingView Night Mode
Switching to Dark Mode can significantly enhance your TradingView experience. Here’s why:
Reduced Eye Strain: Dark Mode is easier on the eyes, especially in low-light conditions, making it ideal for those long trading sessions.
Improved Battery Life: Devices with OLED screens can benefit from extended battery life when using Dark Mode.
Aesthetic Appeal: Many users simply find Dark Mode more pleasing to the eye, making their trading experience more enjoyable.
More Ways to Enhance Your TradingView Experience
TradingView is not just about charts and predictions; it also offers various tools and features to help you make informed trading decisions. Here are some articles that you might find helpful:
Switching to Dark Mode on TradingView can significantly improve your trading experience, from reducing eye strain to enhancing battery life on your device. So, why not give it a try? Once you’ve experienced the comfort of Dark Mode, you might never want to go back.
Don’t forget to explore the additional resources provided to make the most out of your TradingView experience. And, as always, feel free to share your experiences or ask any questions you might have.
This article contains affiliate links I may be compensated for if you click them.
This guide will walk you through the process of adding and customizing the RSI indicator on TradingView, a leading platform for market analysis.
How to Add RSI to Your TradingView Charts
If you’re not yet a TradingView user, you might want to start with their free trial if it’s available. Once you’re signed in, follow these steps to add the RSI to your charts:
Open the chart you want to add the RSI indicator to.
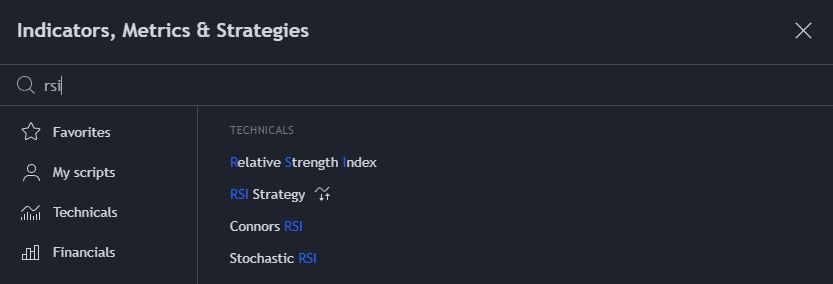
Click on the “Indicators” button located at the top of the chart, or right-click on the chart and select “Add Indicator.”
In the search bar, type “RSI” and select the “Relative Strength Index (RSI)” from the list of available indicators.
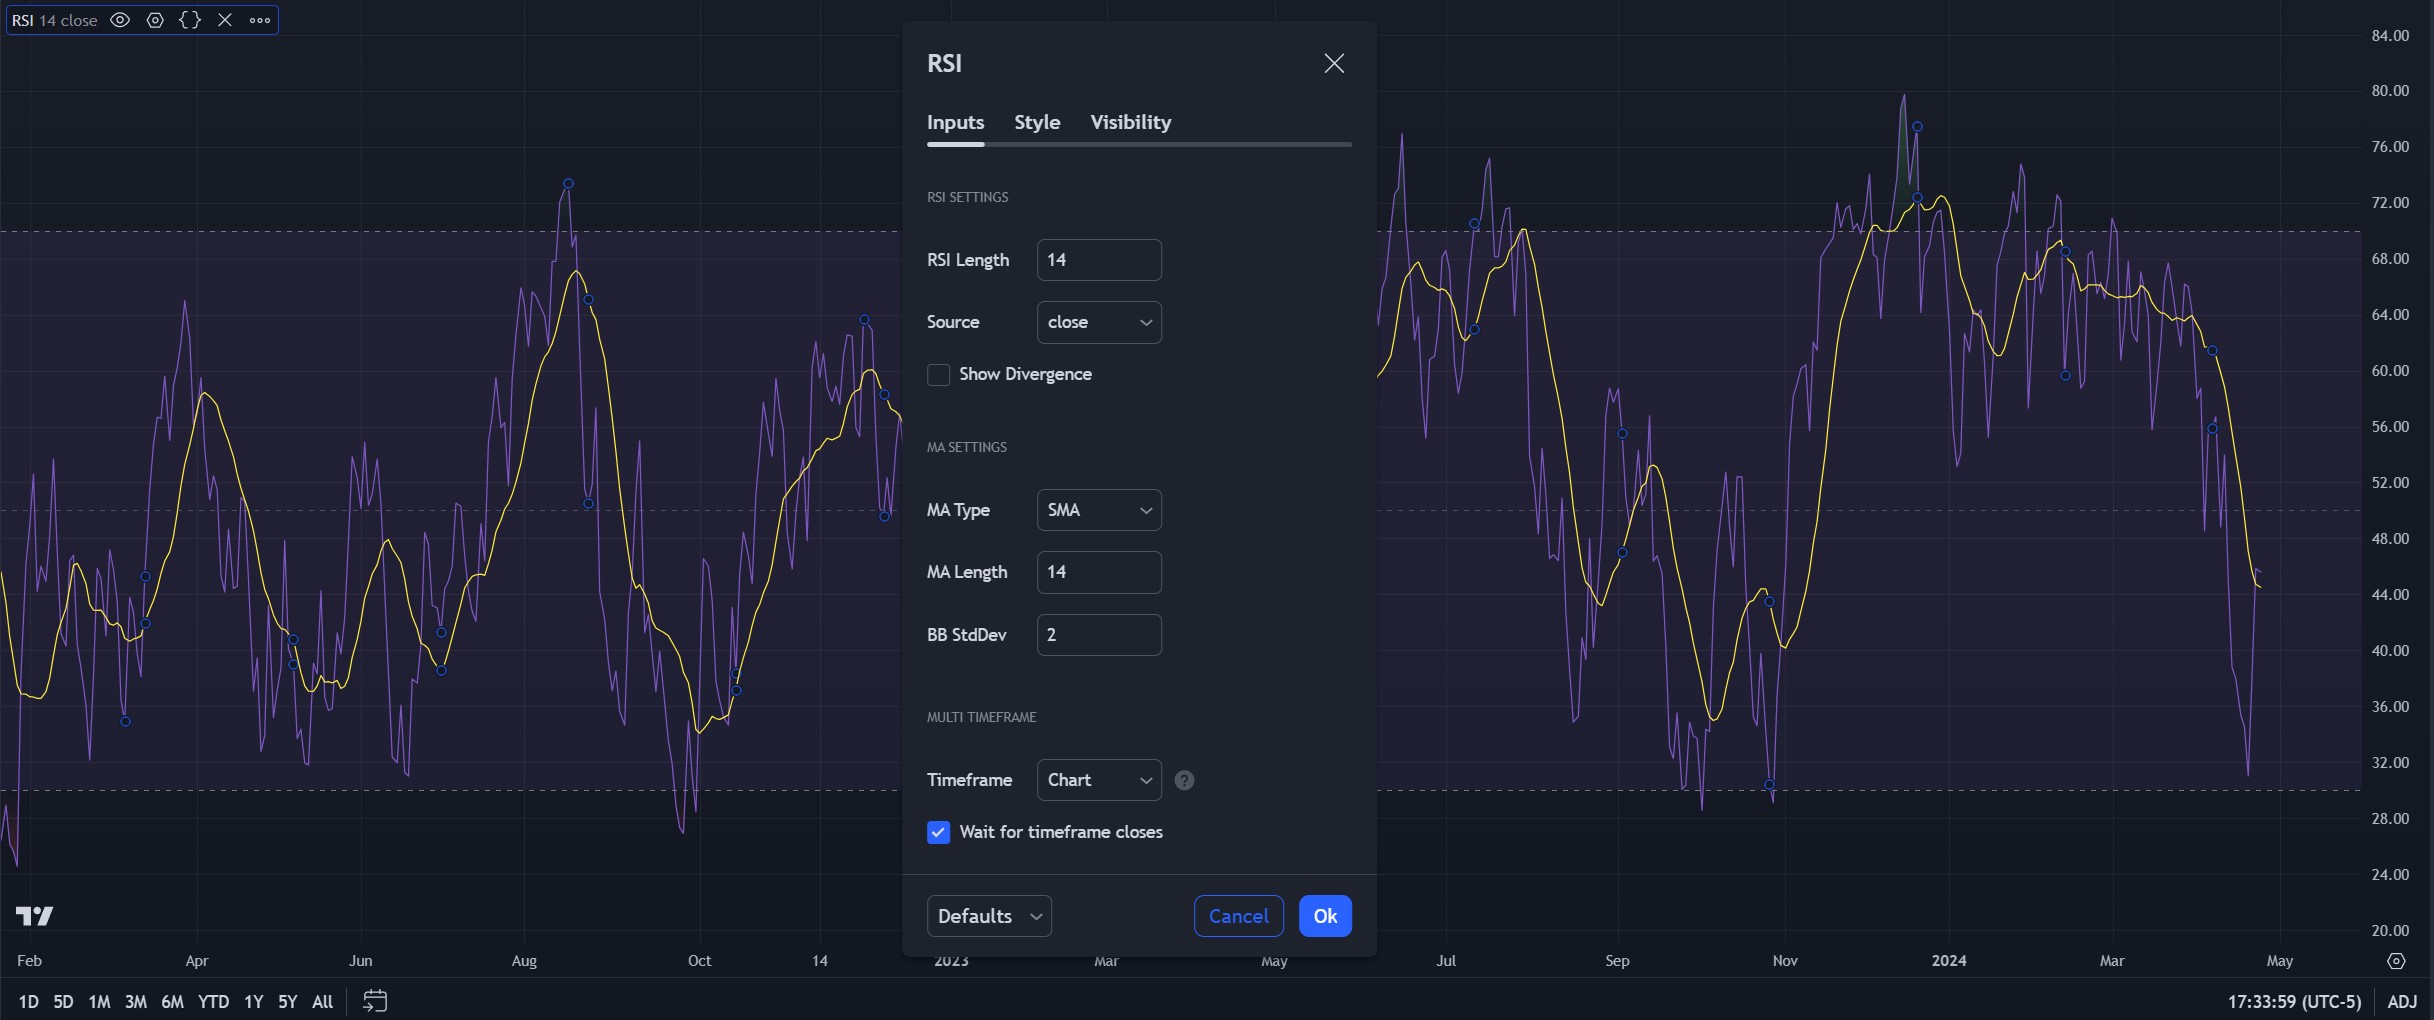
Customizing RSI Settings on TradingView
After you’ve added the RSI to your chart, you can customize its settings and the RSI MA (moving average) settings. By default, each length is set at 14, which is commonly used.
A longer length will account for more than 14 periods and give you data with a longer-term outlook. A shorter RSI length will give you data about only recent price movement. Adjust these according to your preferences, and click the “OK” button to confirm your changes.
When you use my affiliate link to sign up for TradingView, you can get a referral credit and a 30-day free trial of the premium features!
What Time Frame is Best for the RSI on TradingView?
Swing traders commonly use the RSI on the daily time frame, but you can technically use it on any. Day traders may prefer to use it on the one, five, or 30-minute time frame.
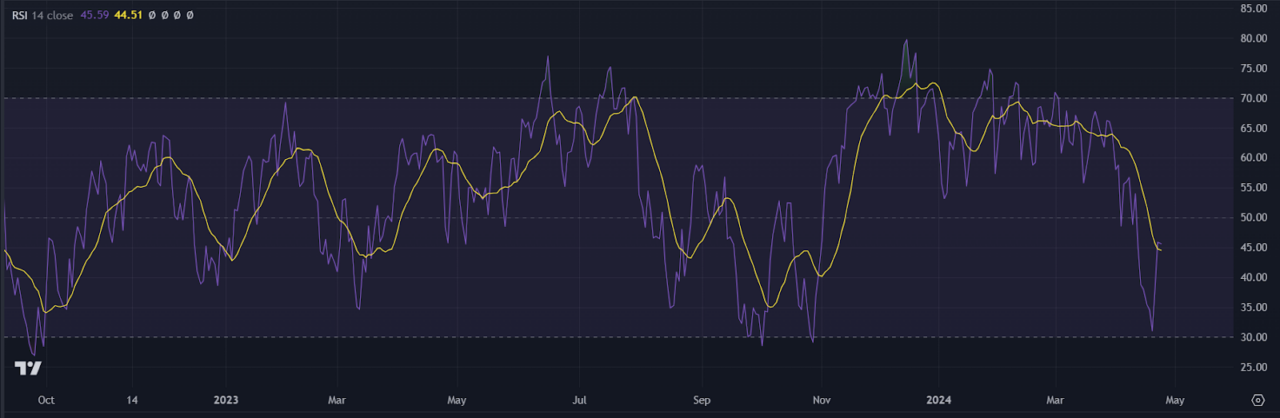
How to Read the RSI Indicator
The RSI, developed by J. Welles Wilder, is a momentum-based oscillator that measures the speed and change of price movements. Ranging between 0 to 100, it is typically used to identify ‘overbought’ and ‘oversold’ conditions.
Identifying Overbought & Oversold Conditions With the RSI
An RSI above 70 indicates an overbought condition, suggesting a potential reversal or corrective move. Conversely, an RSI below 30 indicates an oversold condition, suggesting a potential upward price movement.
TradingView makes it easy to see since a purple box highlights the range between 30 and 70. If the RSI is above the box, the asset is in oversold territory, and vice versa when it is under the box.
Using the RSI Moving Average (MA) on TradingView
When you add the RSI indicator to TradingView, you will notice an MA plotted with it, which can help you determine trend shifts. The RSI MA is designed to smooth out the RSI line and help you get a better feel for momentum. When the RSI crosses over this MA, there is a potential shift in momentum to the upside.
You can customize the MA to be an SMA or an EMA, depending on your trading style. An SMA is best for swing trading, while an EMA puts more weight on recent price movements, making it best for day trading. To learn more about how these moving averages are calculated, you can read my article comparing EMAs vs. SMAs vs. MAs. vs. WMAs.
For example, if the RSI is over 70, indicating an asset is overbought, consider drawing some Fibonacci retracements to see if there is any additional resistance. You can also look for high-volume nodes above the current assets on the volume profile to determine resistance levels and confirm the RSI reading.
If you are a day trader, you may use an indicator like the VWAP with the RSI to help determine price targets. For example, if the RSI reading is over 70, it is probably trading much higher than the VWAP, given you are using a shorter time frame like the 5-minute. Therefore, you can short the asset and use the VWAP as your profit-taking level.
Perfecting Your Strategy With the RSI on TradingView
The RSI is a versatile tool that can greatly enhance your trading strategy on TradingView. By understanding how to add and customize it, you can fine-tune your approach to suit your trading style.If you aren’t already, sign up for a free TradingView account and take your technical analysis to the next level. I believe it is the best charting software for stocks and is completely free to use most features.
When you use my affiliate link to sign up for TradingView, you can get a referral credit and a 30-day free trial of the premium features!
Implied volatility plays a crucial role in options trading, providing insights into the market’s expectations for future price movements. This article will explore how to view and interpret implied volatility on TradingView.
Understanding Implied Volatility (IV)
Implied volatility represents the market’s perception of the magnitude of potential price changes in an underlying asset. A stock’s implied volatility is generally high before major news events like earnings. When implied volatility is high, options will be more expensive since traders expect the stock to move significantly, making options more attractive.
Implied volatility is not a forecast of future volatility but rather a reflection of market expectations.
Factors such as market sentiment, supply and demand dynamics, and upcoming events influence it.
Higher implied volatility indicates a greater expected range of price movements, while lower implied volatility suggests relatively stable price behavior.
tastytrade allows you to plot implied volatility and IV rank on your chart for free if you trade with them.
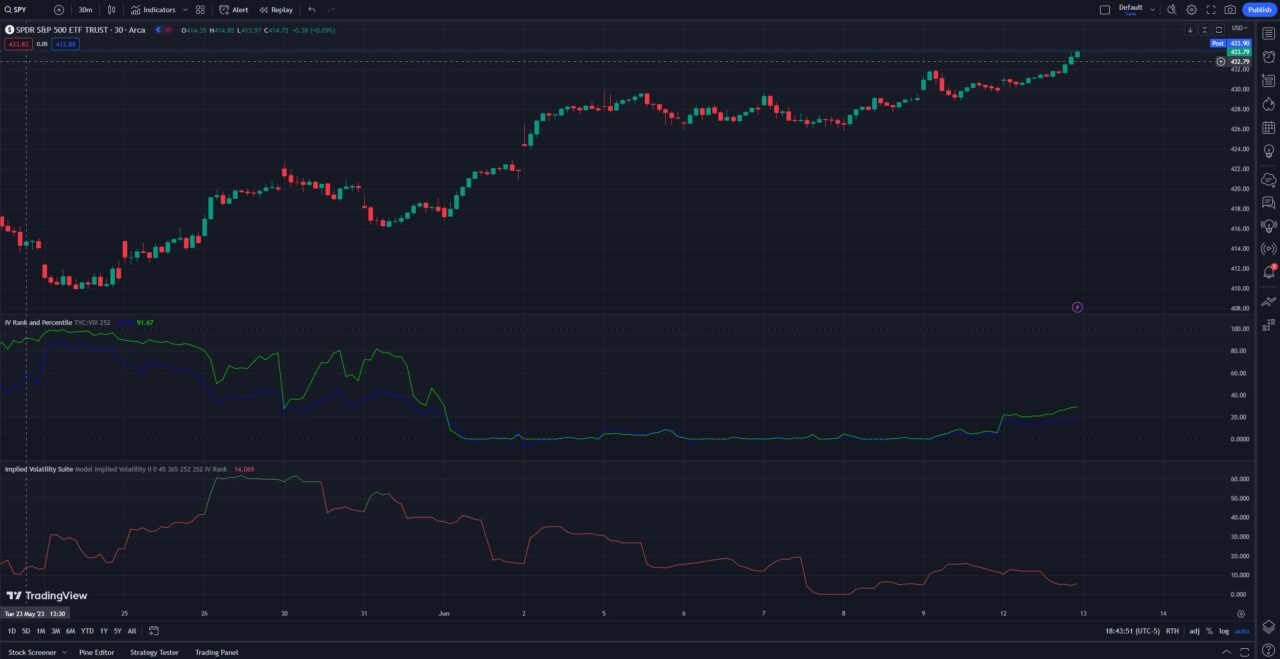
Using TradingView to View Implied Volatility
Here’s how you can access and analyze implied volatility on TradingView:
Navigating to the Symbol’s Chart: After logging into TradingView, search for the symbol you want to analyze and open its chart.
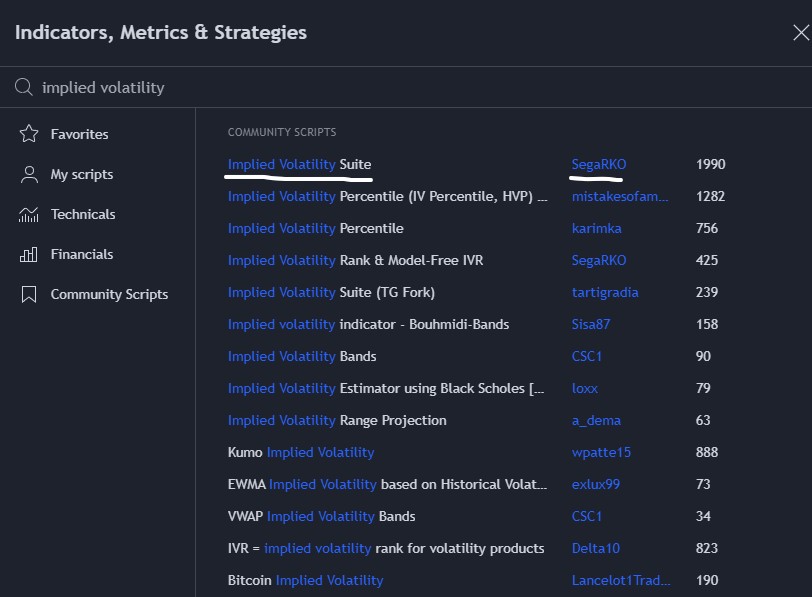
Adding the IV Indicator: Click indicators at the top left of the chart, then type in ‘implied volatility..’ Next, click the implied volatility suite by SegaRKO.
View IV on Your Chart: Once you have added this indicator, you will be able to see implied volatility on your TradingView chart.
Analyzing IV Rank & IV Percentile on TradingView
In addition to viewing implied volatility, TradingView allows you to analyze IV rank and IV percentile. These metrics help you assess the relative value of implied volatility compared to what it was historically. Implied volatility will vary significantly between stocks, so using IV rank or IV percentile helps you compare apples to apples.
How to Add IV Rank and Percentile on TradingView
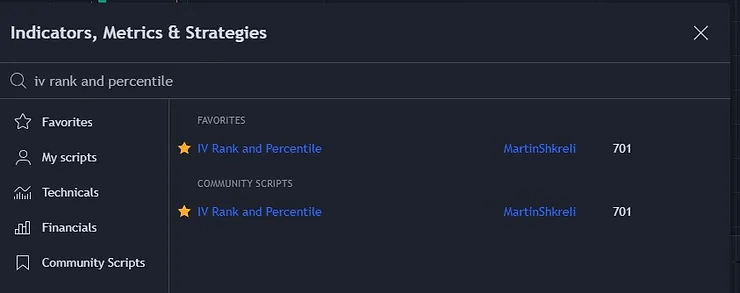
You can utilize the custom IV Rank and Percentile indicator by MartinShkreli, which allows you to view implied volatility rank, and implied volatility percentile on TradingView. Here is how you can add it to your TradingView chart:
Simply follow the link to the indicator and scroll down to add it to your favorites
Next, open any chart, and search for IV Rank and Percentile
Click the indicator to add it, and now you can view IV rank and percentile on your TradingView chart
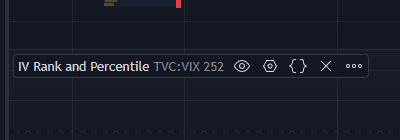
Configuring IV Rank and IV Percentile Indicators: Once you’ve added the IV rank and IV percentile indicators to your chart, customize the settings to suit your preferences. Generally, traders prefer to use the default length of 252 days (one year) when viewing IV rank and percentile.
Hover Over the IV Rank and Percentile Text to Change the Settings: At the bottom left of your chart, if you hover over the name of the indicator, you will see the settings icon appear, which allows you to customize the indicator settings.
IV Rank vs. IV Percentile Readings: IV rank represents the percentile ranking of the current implied volatility compared to its historical range, while IV percentile indicates the percentage of time that the implied volatility has been lower than the current level. Generally, they are pretty similar, so either one can be used to effectively determine whether IV is high or low.
When analyzing IV rank and IV percentile on TradingView, consider the following:
High IV rank suggests the current implied volatility is relatively high compared to its historical range (usually one year), indicating potentially favorable conditions for options sellers.
Low IV rank implies that the current implied volatility is relatively low, which may present opportunities for options buyers.
IV percentile provides a quantitative measure of the current implied volatility level, giving you insights into how frequently the volatility has been lower in the past.
Advanced Tips for Using Implied Volatility Charts on TradingView
To further enhance your analysis of implied volatility on TradingView, consider these advanced tips:
Generally, IV rank and percentile are viewed on the daily chart. Implied volatility can be used on all timeframes.
You can combine implied volatility analysis with price or volume indicators to validate signals and identify potential opportunities. If you combine volatility indicators with tools like the volume profile, you can enhance your strategy.
Implied Volatility Charts on TradingView | Bottom Line
By utilizing TradingView’s charting tools and custom indicators, traders can view implied volatility, implied volatility rank, and implied volatility percentile on their TradingView charts.
Implied volatility is a measure of the expected future volatility or price variance of an asset. It reflects the market’s sentiment and is often used in options trading to forecast potential price changes.
How is implied volatility calculated?
Implied volatility is typically calculated from options using mathematical models like the Black-Scholes formula. TradingView, however, calculates implied volatility indirectly from the spot price using a model or a model-free approach like the VIXfix.
How can I access and analyze implied volatility on TradingView?
To access and analyze implied volatility on TradingView, you can navigate to the symbol’s chart and add a custom implied volatility (IV) indicator. This will provide you with the necessary data and analysis tools to interpret implied volatility levels.
What does implied volatility indicate in options trading?
Implied volatility in options trading indicates the market’s expectations regarding future price movements. Higher implied volatility suggests greater uncertainty and potential for larger price swings, while lower implied volatility indicates more stability and smaller price fluctuations.
Is implied volatility available for all symbols on TradingView?
Implied volatility on TradingView may be available for a wide range of symbols, but the availability may vary. It is recommended to check the platform and specific symbol you are interested in to determine if implied volatility data and analysis are provided.
Can I customize and create my own implied volatility indicators on TradingView?
TradingView offers a variety of customization options, including the ability to create and modify indicators. While the platform provides pre-built implied volatility indicators, you can also explore creating your own custom indicators tailored to your specific needs and trading strategies.
What are IV rank and IV percentile?
IV rank and IV percentile are metrics that help you assess the relative value of implied volatility. They compare the current implied volatility with its historical range over a certain period of time.
How can I view IV rank and IV percentile on TradingView?
To view IV rank and IV percentile on TradingView, you can add custom scripts or indicators that calculate and visualize these metrics. For example, you can use the Implied Volatility Suite TG Fork or the IV Rank and Percentile indicators.
How can I use IV rank and IV percentile in options trading?
By comparing the current implied volatility with its historical range, IV rank and IV percentile can help you determine when options are overpriced or underpriced and how to adjust your trading strategies accordingly. Generally, high IV rank or IV percentile indicates overpriced options, while a low IV rank or IV percentile indicates underpriced options.
This article contains affiliate links I may be compensated for if you click them.
The market profile is an advanced indicator that displays a combination of time spent and volume traded at each price level. It is generally only applicable to day traders, but it can also be used to determine optimal entry and exit points for swing trading.
In this comprehensive guide, we’ll explore the the history, concepts, and use cases of market profile for traders. We’ll also compare it to the volume profile and explain how you can access these indicators on TradingView.
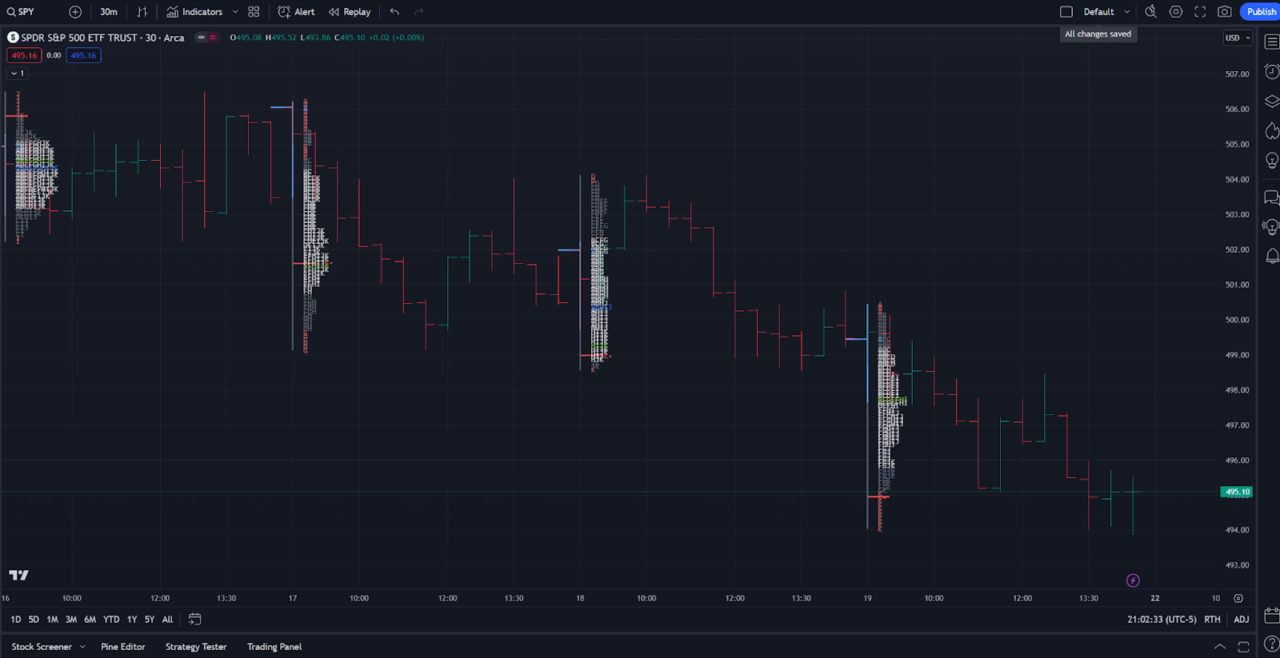
How to Access the TPO Charts on TradingView
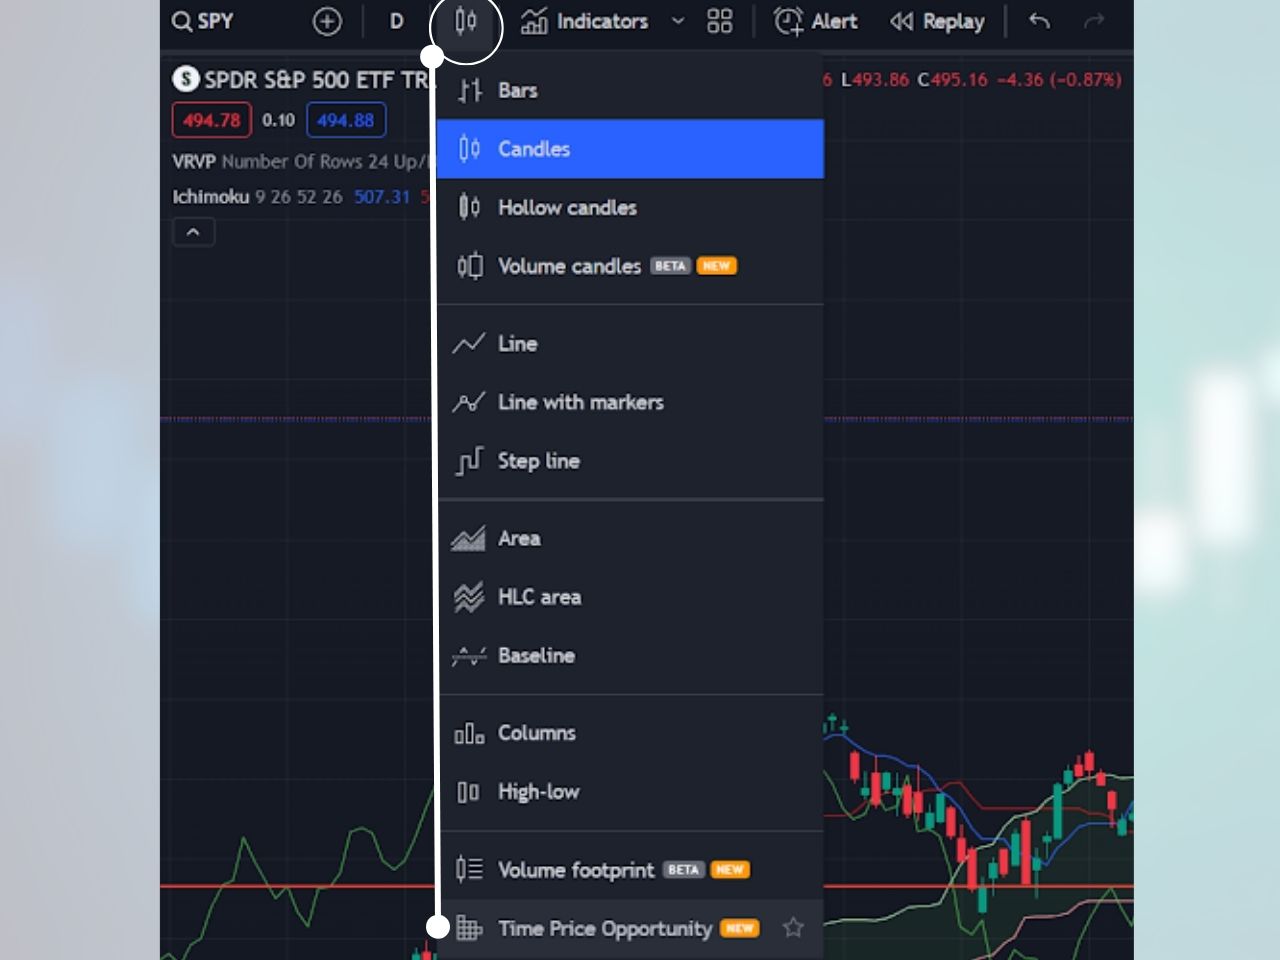
The market profile on TradingView is a chart type called “Time Price Opportunity.” Here is how you can add it to your chart:
1- Click on the chart type at the top left of a TradingView chart, right to the left of indicators
2- Click “Time Price Opportunity,” and the market profile will be added to your chart
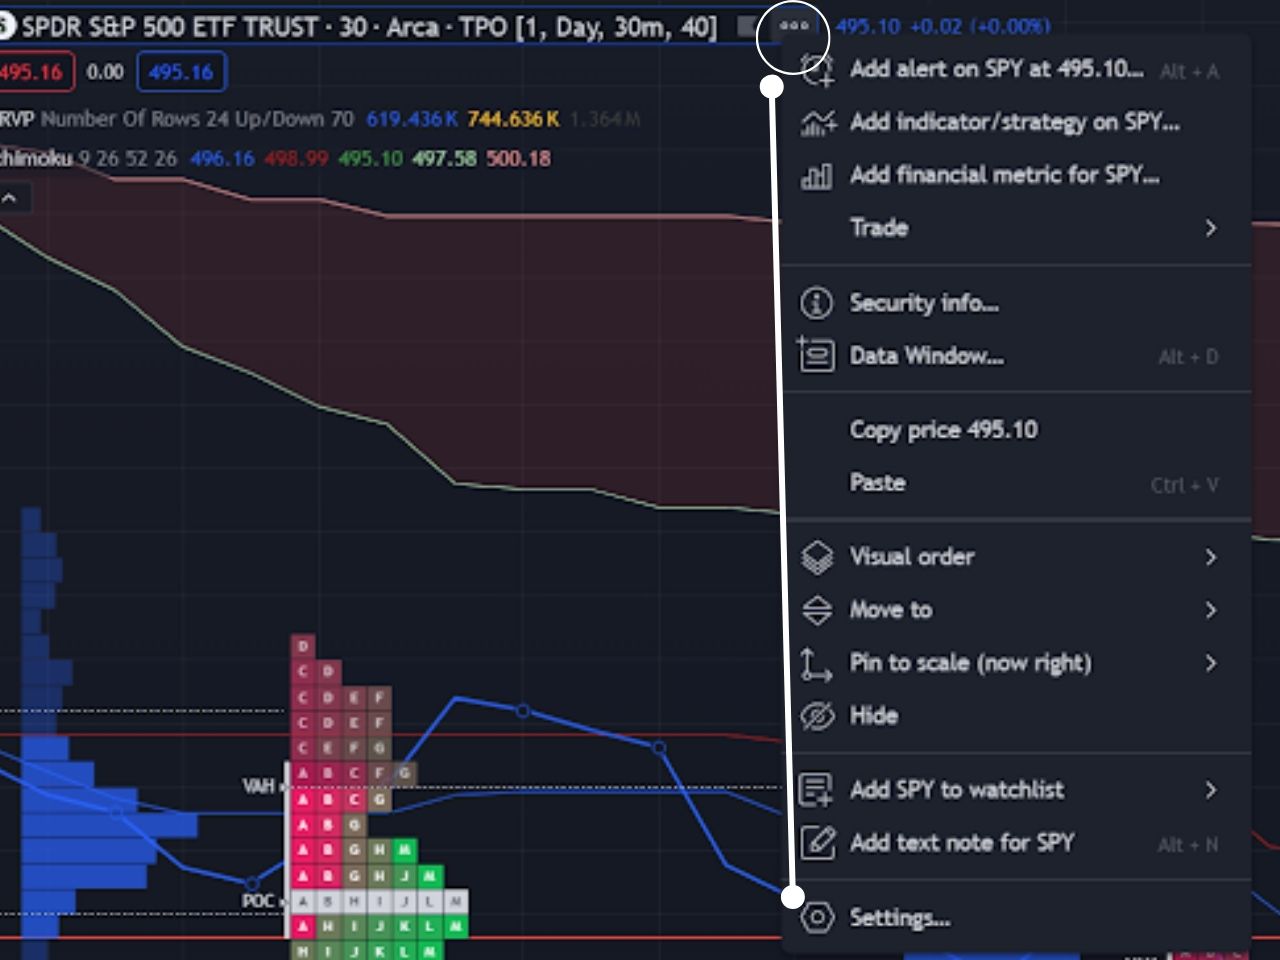
Customizing the Market Profile Settings on TradingView
You can customize many aspects of the market profile by hovering over the symbol at the top left corner, clicking the three dots, and then clicking settings in the drop-down menu. You can customize the period length, block size, row size, value area, and more.
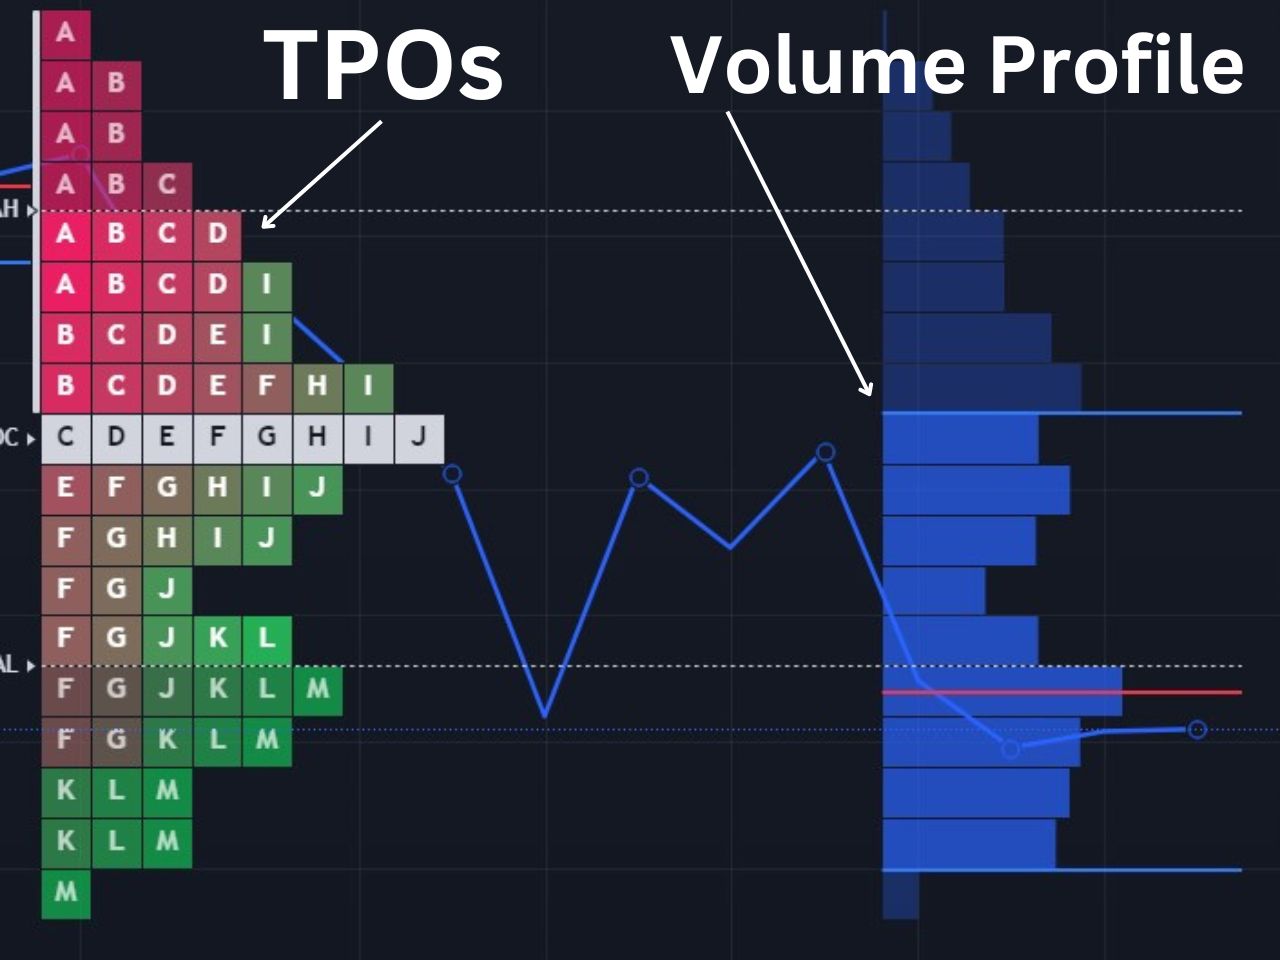
The time price opportunity chart on TradingView consists of several components, including the time price opportunity and the volume profile, which work together to form the market profile.
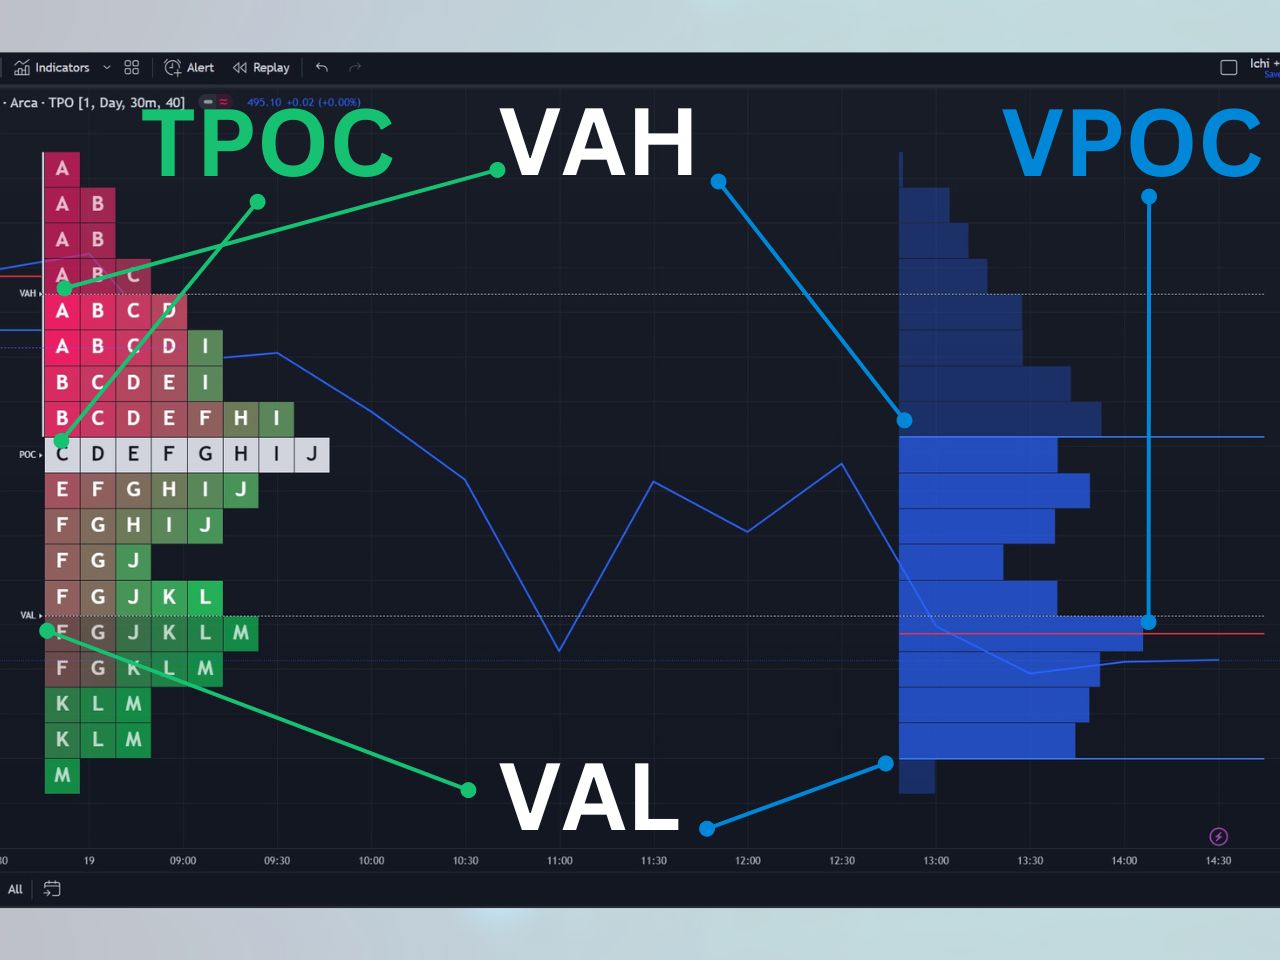
Time Price Opportunities (TPOs)
Each of the blocks in the image below are TPOs, which stack based on how much time is spent at a specific price level. Each letter represents a specific time period, which is usually set to 30 minutes, as recommended by the founders of the market profile. For example, A would be the first 30 minutes of the market, and any price level an A is present, the asset traded at within the first 30 minutes.
Time Point of Control (TPOC)
The point of control is the price level which the price has spent the most time at. It is essentially the levels where the most TPOs exist, meaning the price has traded at the level for longer than any other for that day.
Value Area
The value area consists of the price levels in which 70% or more of the time spent has occurred. The top of the value area is referred to as the value area high (VAH), and the bottom of the value area is known as the value area low (VAL).
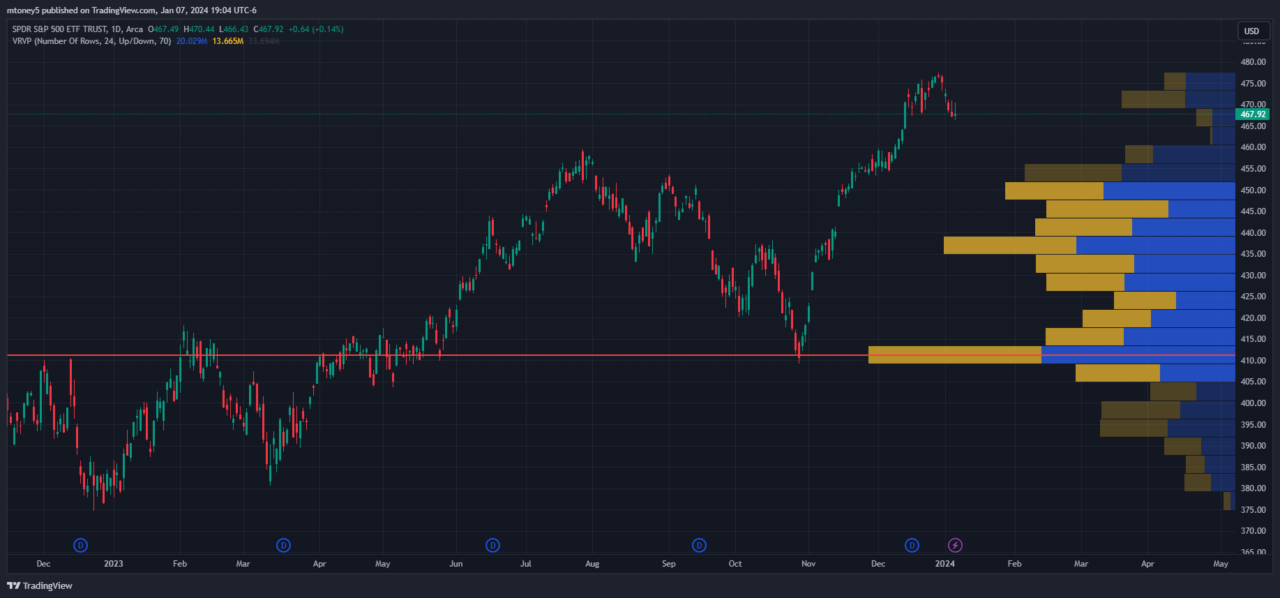
Volume Profile
The volume profile is part of the market profile and consists of mostly the same components, except it is based on volume rather than time. The volume profile is set on the right side of the price action on TradingView, while the time price opportunity chart is on the left side. Here are the components of the volume profile:
Volume Point of Control (VPOC)
The VPOC is the price level at which the most trading volume has occurred. It is similar to the TPOC but tracks volume rather than time.
Volume Profile Value Area
The volume profile also consists of a value area, except it is based on where 70% of the volume has traded rather than time. The value area high (VAH) is the top of the value area, and the value area low (VAL) is the bottom of the value area. Price levels outside of the value area consist of the remaining 30% of volume activity not included in the value area.
Reading the Market Profile
The market profile can form a few significant types of patterns that determine optimal trading opportunities. Examples of these patterns include:
Single Prints
A single print is any part of the market profile that is only a single TPO wide. The idea with a single print is that very little time is spent at these price levels, and it should act as strong support or resistance.
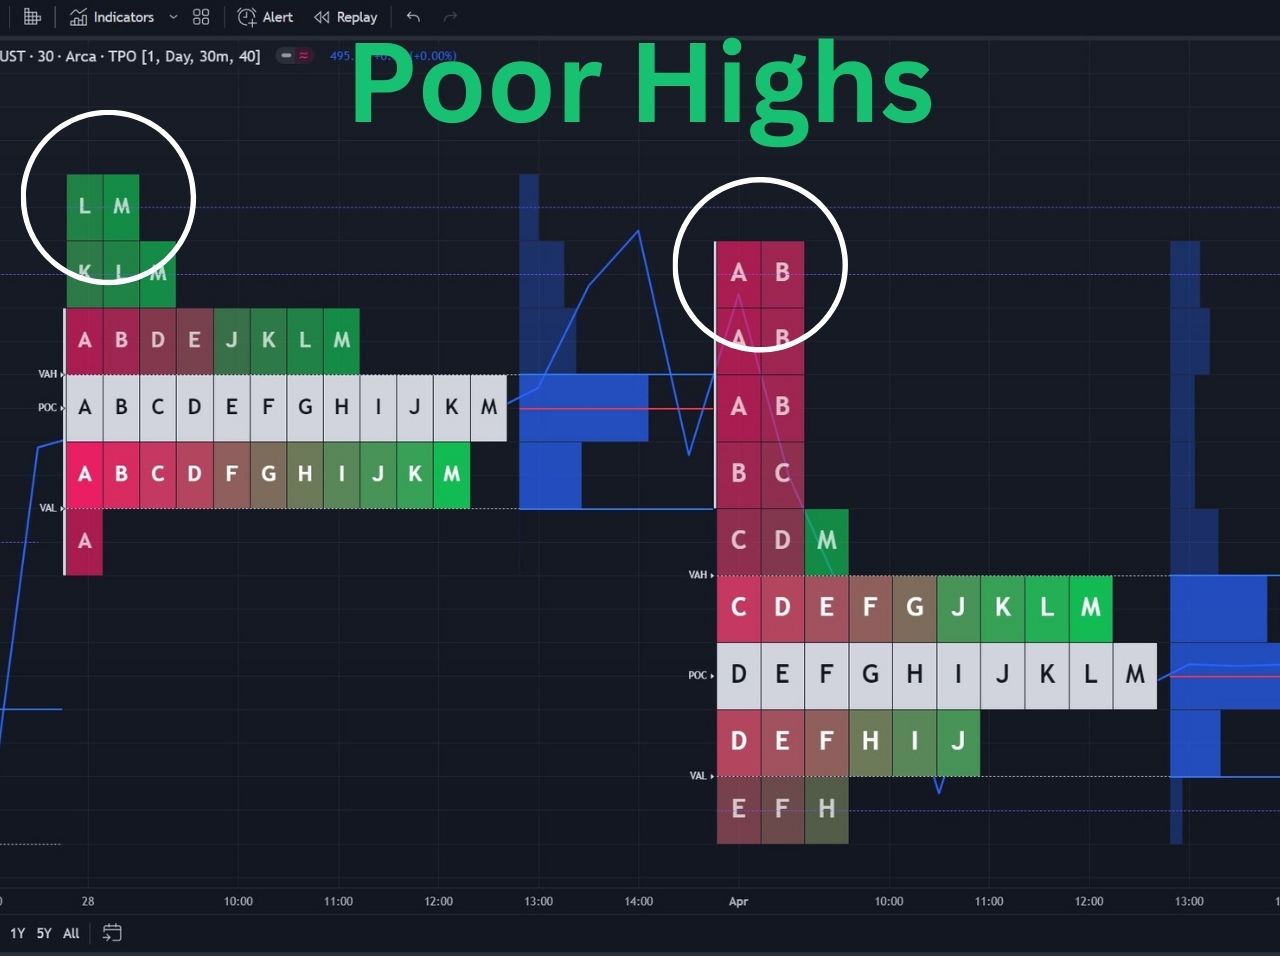
Poor High
A poor high occurs when the market reaches a high point of a trading day and pulls back at least two times, with two different TPO periods (letters). The following must be true to signify a poor high:
There are two TPO periods (letters) at the top of the range
There are at least two to three columns of TPOs forming a flat-looking top
Implications of Poor Highs
A poor high can imply a couple of scenarios:
Longs are trapped at the high of the day and exit their positions at breakeven when the high is reached, causing the price to retract back down.
When poor highs are visited in future sessions, there is a strong chance price breaks higher to repair itself since poor highs lack symmetry and are not considered to be a proper market structure.
You can toggle the poor high setting on in the time price opportunity setting on TradingView so it can automatically detect them for you, which are signified by a dotted purple line.
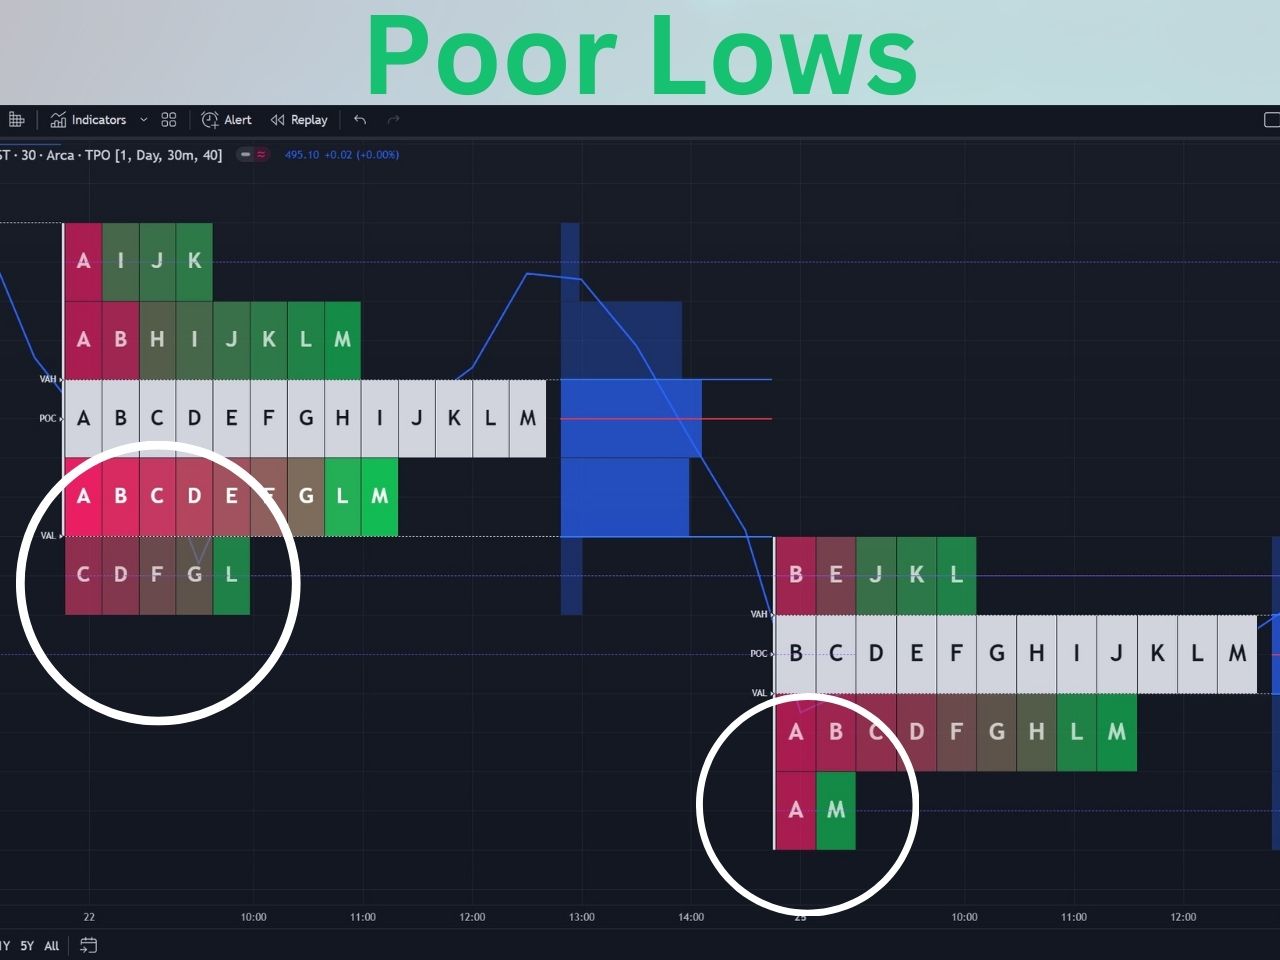
Poor Low
A poor low occurs when the market reaches a low point of the day, then moves back up, and revisits the low a second time within a different TPO period. It is the same as a poor high except it occurs at the low of a trading day. The following must be true to signify a poor low:
There are two TPO periods (letters) at the bottom of the range
There are at least two to three columns of TPOs forming a flat-looking bottom
You can toggle the poor low setting on in the time price opportunity setting on TradingView so it can automatically detect them for you, which are signified by a dotted purple line.
Implications of Poor Lows
A poor low implies a couple of scenarios:
Shorts are trapped at the poor low and may buy their positions back at breakeven, causing prices to move higher.
If a poor low is revisited in a future session, there is a good chance it will repair itself and break lower since poor lows are not considered a symmetrical market structure.
Excess High
An excess high is when there are at least two single prints at the high of the market profile structure. Excess highs are formed when the price moves up and quickly comes back down. Excess highs are normally where long candle wicks form. An excess high is the exact opposite of a poor high, since little time is spent at these price levels.
Excess Low
An excess is signified by at least two single prints at the low of a market profile structure. On a standard candlestick chart, there will normally be a long wick here on a 30-minute candle. Excess lows are the exact opposite of poor lows since very little time is spent at the price level, and there is only one column of TPOs.
Market Profile vs. Volume Profile
There isn’t necessarily a difference between the volume profile and the market profile, as the volume profile is simply one component of the market profile. The market profile is made up of two components:
The market profile is a versatile tool that can be applied in various trading scenarios:
Day Trading: Short-term traders can use the market profile to identify areas of value and high-volume trading zones.
Big Players: The market profile provides insights into the actions of big buyers and sellers, helping traders follow the “big sharks” in the market.
Auction Dynamics: Understanding the concepts of “Poor Highs” and “Poor Lows” helps traders make informed decisions based on auction dynamics.
Consider watching my video on the TradingView TPO charts for a visual guide as well:
How to Use the Market Profile for Free on TradingView
Since the time price opportunity chart on TradingView requires a premium subscription, you can check out the RS Market Profile custom indicator to access a similar feature for free. It offers many of the same benefits of the native indicator, but it is much less intuitive.
The origins of Market Profile can be traced back to the trading floors of the Chicago Board of Trade (CBOT). It was here that the legendary trader J. Peter Steidlmayer developed this innovative charting technique in the early 1980s. Made public in 1985, the market profile quickly garnered acclaim for its ability to provide traders with unique insights into market behavior.
The market profile is based on the auction market theory, which signifies that buyers and sellers cause imbalances, and that markets eventually return to the fair value. The fair value in the market profile is signified as the point of control, including the volume and time point of control (VPOC & TPOC).
When you use my affiliate link to sign up for TradingView, you can get a referral credit and a 30-day free trial of the premium features!
The Bottom Line: Mastering Market Profile Trading Strategies
The market profile is a highly complex indicator, and not many traders completely understand its full potential. The pioneers of the market profile chart are J. Peter Steidlmayer, Steven B. Hawkins, and Jim (James) Dalton, I recommend you look into the following books to learn more about it, which are my Amazon affiliate links:
TradingView is a standalone charting platform that allows you to track all markets, including stocks, futures, crypto, forex, and more. NinjaTrader is a futures trading brokerage that allows you to trade futures and options on futures, plus provides charting software you can trade from.
While TradingView is not a brokerage itself, it integrates with various brokers such as Tradovate, Interactive Brokers, Webull, and more. You can connect one of these brokers to TradingView, which will allow you to trade directly from the TradingView charts.
Not a broker, but you can chart stocks, ETFs, futures, crypto, and forex
Advanced web-based charting platform, downloadable desktop app, and mobile app
Provides real-time data for free when possible, and you can purchase real-time data subscriptions from exchanges
$12-$60 per month
Overview of NinjaTrader
NinjaTrader is a futures trading platform known for its advanced charting, trade simulation, and market analysis tools, targeting active traders who require detailed technical analysis capabilities and automated trading strategies.
NinjaTrader has extremely competitive commissions for futures contracts, but doesn’t support many other assets. There is also a minimum account activity fee, so you must trade at least once per month to avoid this $25 fee.
Platform Features: NinjaTrader’s key offerings include advanced charting, backtesting capabilities, and the ability to create custom indicators and strategies using NinjaScript.
Pricing and Subscription: NinjaTrader provides a free version with essential features and the ability to purchase packages to get reduced trading commissions.
Overview of TradingView
TradingView is an advanced charting and social platform for traders. You can build custom indicators, backtest strategies, and utilize community scripts with its proprietary Pine Script coding language.
TradingView is my top pick as the best overall charting platform because it offers real-time data for free whenever possible, allowing everybody to track the markets without paying. You can also utilize most of the popular indicators with just a free account, but premium features include advanced indicators like footprint charts and the volume profile.
Platform Features: TradingView’s social forum allows users to exchange ideas, while its extensive range of indicators and technical analysis tools support informed trading decisions.
Pricing and Subscription: TradingView offers different subscription levels, including a free plan with basic features. Premium plans unlock the ability to buy extra real-time data, additional charting tools, and other advanced features.
This table now includes the information you provided about NinjaTrader and TradingView, with the same styling and structure as before. The left column remains sticky for mobile viewing, and the specified affiliate links and button text have been incorporated as requested.
Can You Connect NinjaTrader to TradingView?
You cannot connect NinjaTrader to TradingView as a native feature, but if you sign up for a funded trader platform like Apex Trader Funding you can use TradingView charts with the NinjaTrader platform. If you do not want to trade with a funded trader platform you should consider connecting your TradingView account to a supported platform like Tradovate.
If you get a funded NinjaTrader account with Apex Trader Funding, you don’t have to risk your own capital and can use TradingView charts. However, you should always be careful when trading futures, as it is a high-risk, high-reward game that can go either way. Please note that nothing in this article should be construed as financial advice, and always trade with caution, regardless of which platform you choose.
Is Tradingview Charting Better Than Ninjatrader?
Overall, TradingView is the best charting software for stocks, while NinjaTrader is a futures trading brokerage platform. TradingView charting is easier to use than NinjaTrader, but to trade directly from TradingView, you have to connect with a supported broker. If you are interested in futures trading, I would recommend using TradingView charts while trading on a platform like NinjaTrader, Tradovate, or tastytrade.
Harmonic patterns are a fascinating and powerful tool in the world of trading. Based on Fibonacci numbers, these geometric price structures provide traders with potential entry and exit points in various financial markets.
TradingView, a popular charting and technical analysis platform, offers harmonic scanner indicators that detect and analyze these patterns. This article will explore the key features and practical applications of the Harmonic Scanner and Harmonic Scanner Pro indicators available on TradingView.
Understanding Harmonic Patterns
Common Harmonic Patterns
Harmonic patterns come in different variations, each with unique characteristics. Some of the most common harmonic patterns include:
Gartley
Bat
Butterfly
Crab
These patterns typically consist of five points—X, A, B, C, and D—and are formed by a series of converging Fibonacci retracements and extensions.
Fibonacci Ratios in Harmonic Patterns
The essence of harmonic patterns lies in the precise Fibonacci ratios that define their structure. Each pattern is characterized by a set of specific Fibonacci levels that determine the ideal proportions between the different legs of the pattern.
Predicting Price Movements
Traders use harmonic patterns to predict potential price reversals and continuation movements. By identifying completed or emerging patterns, traders can establish strategic entry and exit points, manage risk, and optimize their trading decisions.
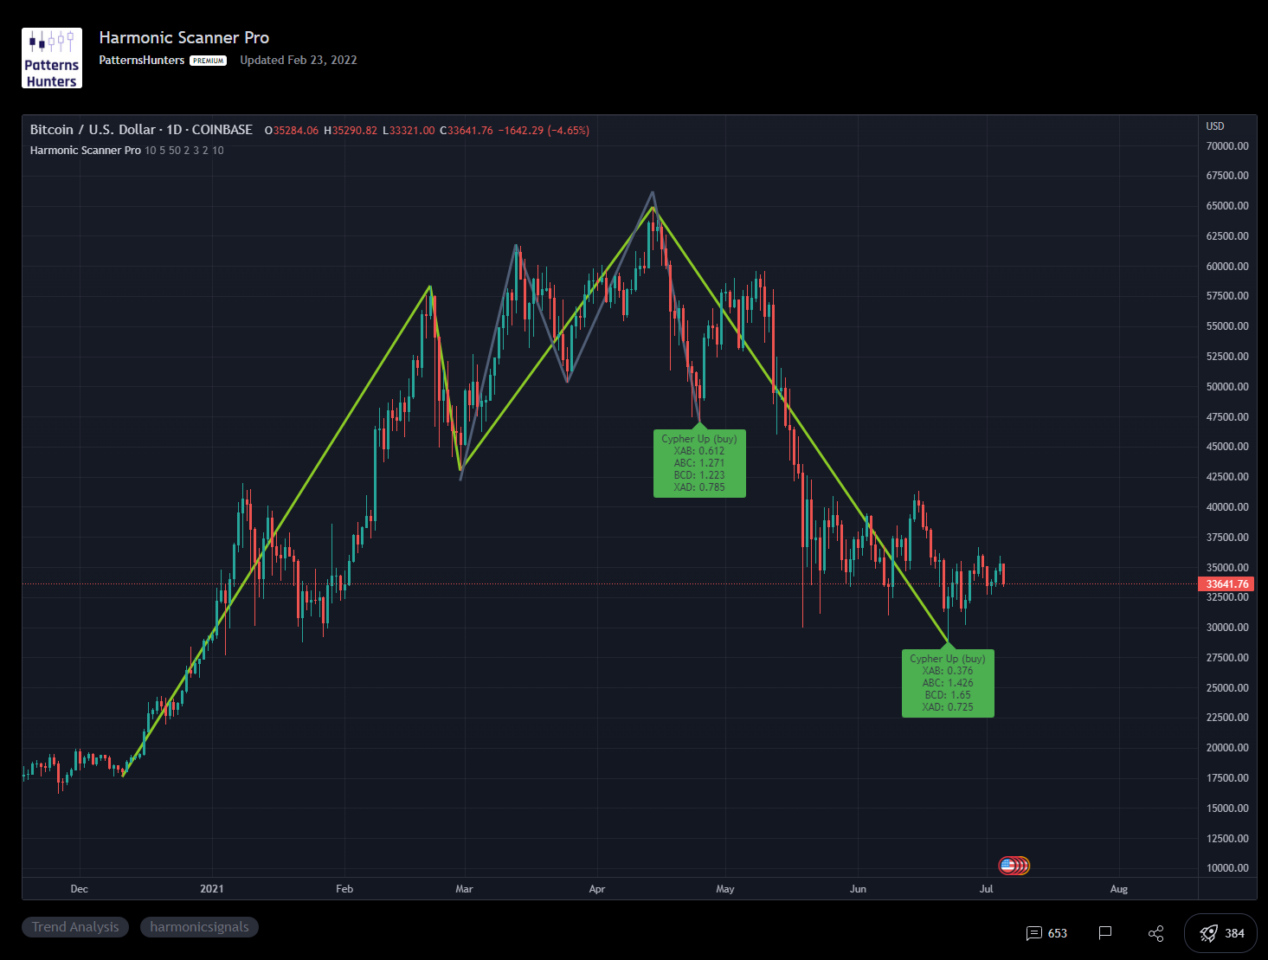
The Harmonic Scanner by PatternsHunters on TradingView
Key Features of the Harmonic Scanner
The Harmonic Scanner by PatternsHunters is an indicator designed to detect harmonic formations such as Gartley, Bat, Butterfly, and Crab. Its key features include:
Detection of various harmonic formations
In-depth analysis of up to 50 high/low points
Customizable error margin and retracement levels
Practical Use of the Harmonic Scanner
The Harmonic Scanner provides valuable insights for traders seeking to capitalize on harmonic patterns. Traders can make more informed decisions by analyzing patterns and identifying buy/sell signals. For instance, point D of a pattern may signal a potential reversal, prompting traders to take a long or short position.
The Advanced Harmonic Scanner Pro by PatternsHunters on TradingView
Enhanced Features of the Harmonic Scanner Pro
The Harmonic Scanner Pro is an advanced version of the standard Harmonic Scanner, offering additional features for a more comprehensive analysis:
Customization of parameters and error tolerance
Detection of multiple patterns simultaneously
Alerts, pattern hiding, and configurable retracement levels
Color differentiation for each formation
Benefits of Using the Harmonic Scanner Pro
The Harmonic Scanner Pro is a versatile tool for traders interested in the intricacies of harmonic patterns. By customizing parameters, setting alerts, and analyzing multiple patterns, traders can gain insights into how specific securities react to harmonic patterns, thereby improving their trading strategies.
Special Offer: Discount on TradingView Premium Subscription
If you’re considering upgrading to a TradingView premium subscription, we have an offer just for you!
By using our affiliate link, you can get a discount on your TradingView premium subscription, and new users usually enjoy a 30-day free trial. This is a fantastic opportunity to access premium features and enhance your trading experience.
The utility of harmonic scanner indicators on TradingView cannot be overstated. Harmonic patterns offer traders a systematic approach to identifying trading opportunities, and the Harmonic Scanner and Harmonic Scanner Pro indicators make it easier to detect and analyze these patterns.
Whether you’re a novice or an experienced trader, these indicators can enhance your understanding of the markets and contribute to your trading success.
One of the best features of TradingView is the ability to set alerts, which helps traders and investors keep an eye on how the markets are moving.
In this article, we’ll walk you through a comprehensive guide on how to set alerts on the TradingView web platform and mobile app.
Understanding TradingView Alerts
Alerts on TradingView are notifications sent to you based on specific criteria or conditions in the market.
These can be price movements, indicator values, or even drawing tool breaches.
How to Set Alerts on TradingView
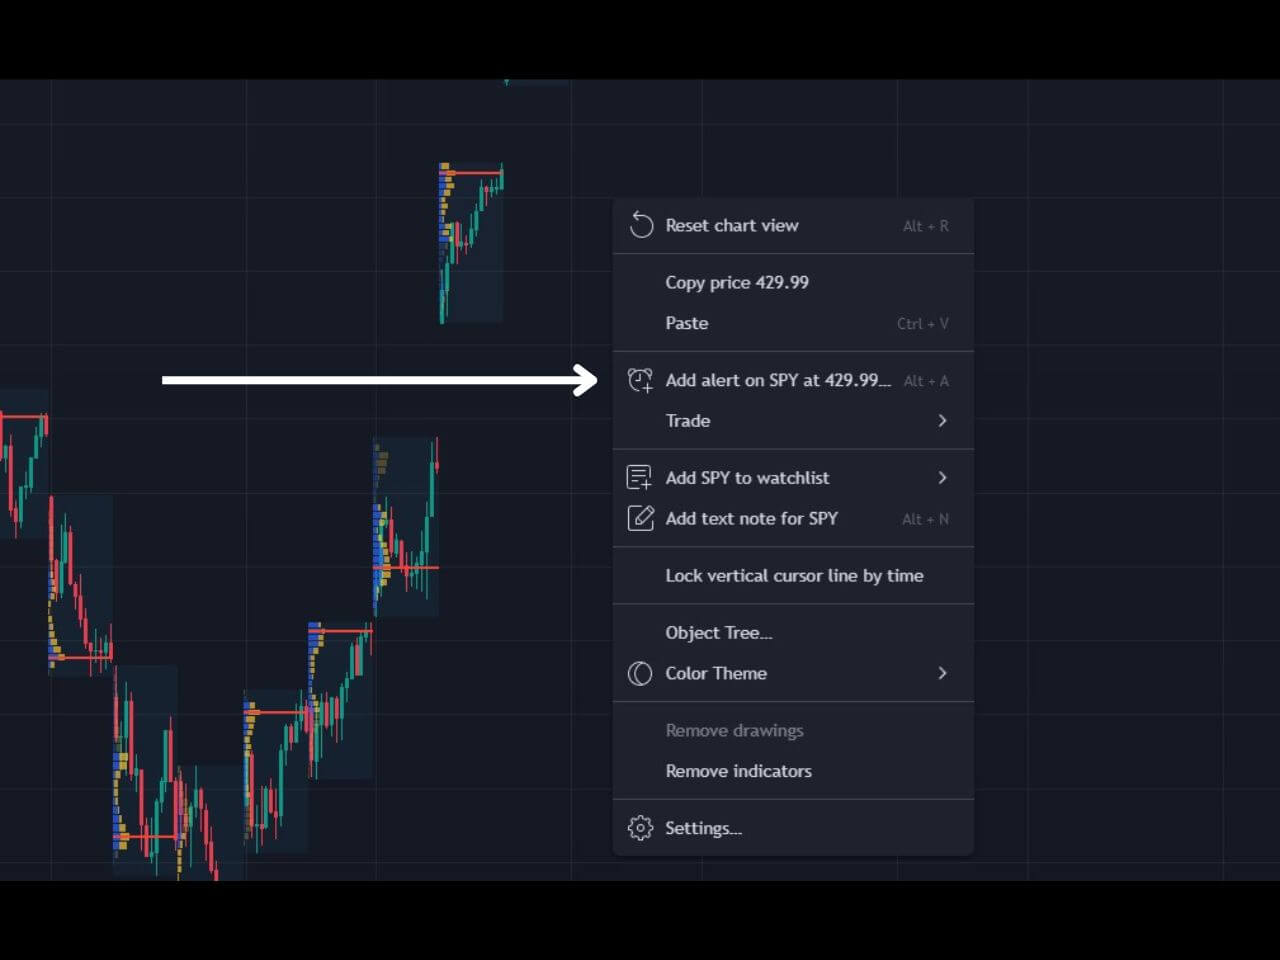
To set up a basic price level alert:
Open the chart of the asset you want to monitor.
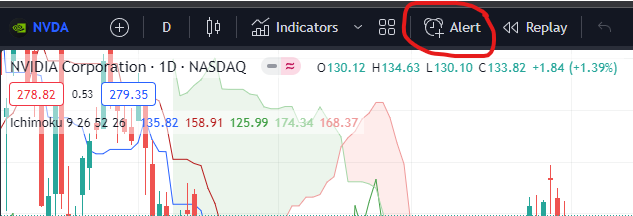
Right-click on the chart and select ‘Add Alert’. Or click the alert icon at the top of the chart.
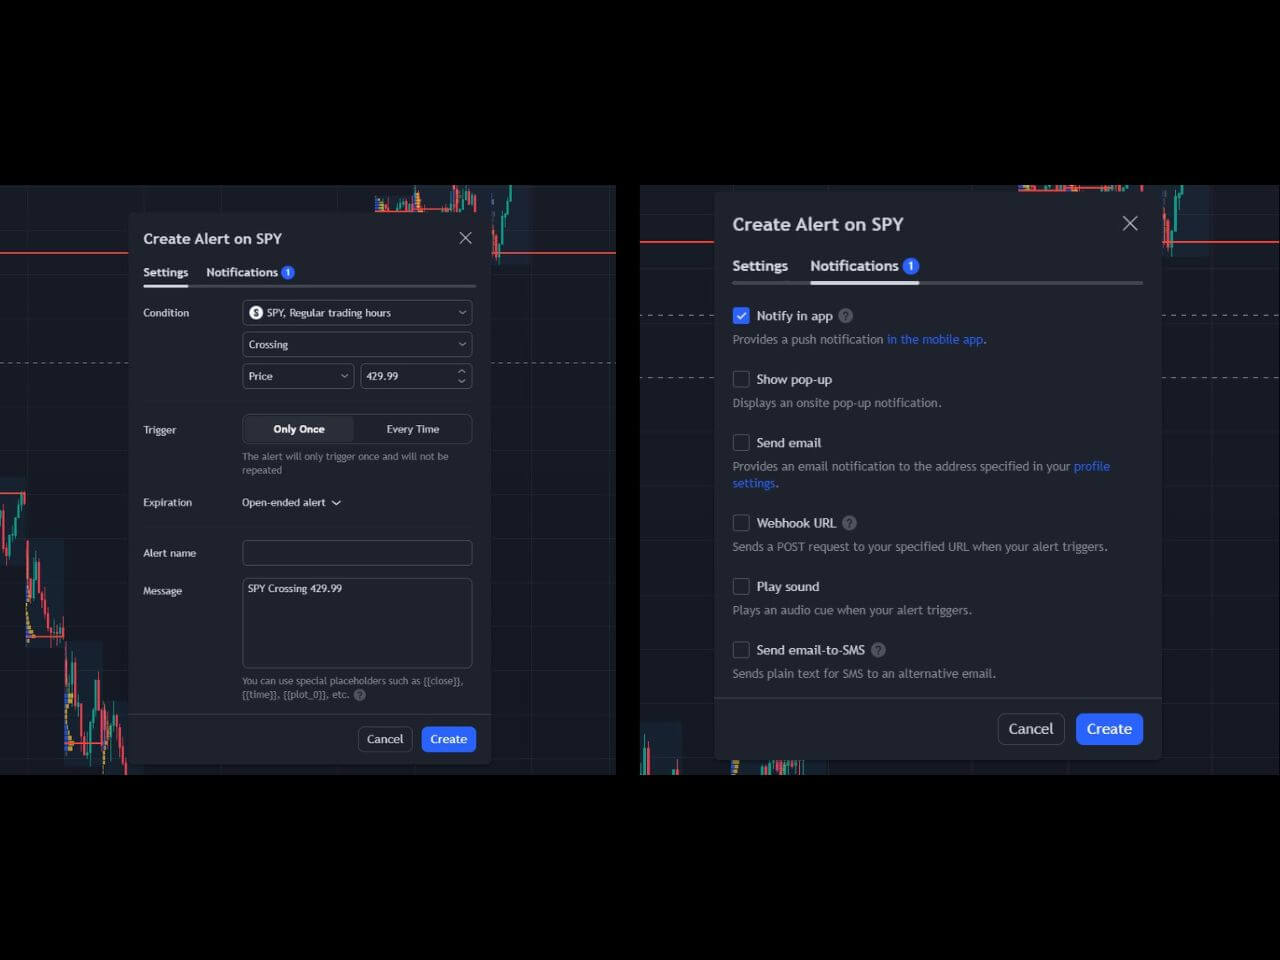
Choose the ‘Price’ option and set your target price level.
Specify whether you want to be notified when the price crosses, crosses up or crosses down.
Specify how many times you want the alert to trigger
Customize your alert by selecting how you want to be notified (e.g., on-screen pop-up, email, or SMS).
Name your alert for easy identification and click ‘Create.’
How to Set Indicator Alerts on TradingView
TradingView also allows setting alerts based on specific indicators or drawing tools:
Indicator-based Alerts: Select an indicator from the ‘Condition’ dropdown menu when creating an alert. Set your desired value or condition for the alert. You can also right-click on the indicator and choose “Add Alert,” then select the type of alert and configure its parameters.
Drawing Tool Alerts: Create a trendline or other drawing tool on the chart. Right-click on it and set an alert for when the price crosses or touches the tool.
Multiple Condition Alerts: Combine several conditions (like price and indicator values) for a single alert, enabling more precise market monitoring.
Managing and Organizing Alerts
You can edit, pause, or delete your alerts at any time:
Go to the ‘Alerts’ tab by clicking the clock icon on the right side of the chart.
Hover over an alert to see options for editing or deleting it.
Organize your alerts by naming them according to their purpose or the asset they monitor.
Alert Notification Methods
You can choose how to be notified when an alert is triggered:
Notify on App: Receive notifications on your mobile device via the TradingView app.
Show Pop-up: Get pop-up messages on your TradingView chart window.
Send Email: Receive email notifications.
Play Sound: Hear an audio alert.
Send Email-to-SMS: Get text messages to your phone.
Webhook URL: Sends a POST request to a specified URL.
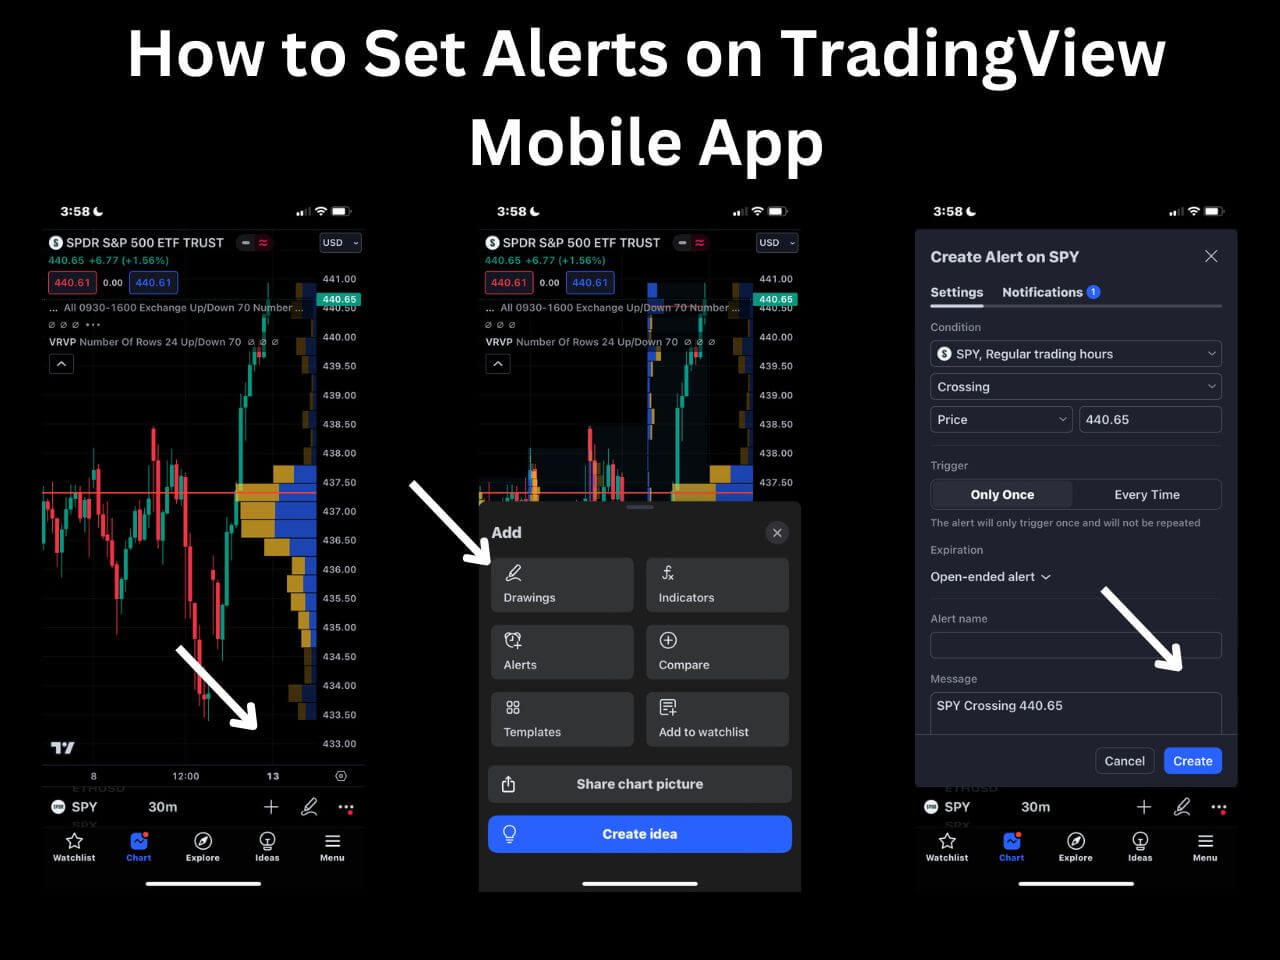
How to Set Alerts on TradingView Mobile App
To set alerts on the TradingView mobile app:
Tap the plus icon at the bottom of the chart.
Tap alerts.
Specify the parameters and tap create alert.
Tips for Effective Alert Management
To use alerts effectively:
Set realistic thresholds for alerts to avoid frequent, unnecessary notifications.
Review and adjust your alerts regularly to align with your trading strategy changes.
How to Set Alerts on TradingView – Bottom Line
Alerts are a powerful feature on TradingView that can significantly enhance your trading efficiency.
By setting and managing alerts effectively, you can stay ahead of market movements, making informed decisions without the need for constant monitoring.