TradingView is a web-based platform that offers live quotes, charts, and tools for technical analysis. You can also use TradingView on your mobile device with the TradingView app for iPhone and Android.
In this article, we will guide you through the basics of using the TradingView app and show you some of its features. If you haven’t already, consider signing up for a TradingView free trial so you can access everything it has to offer at no cost.
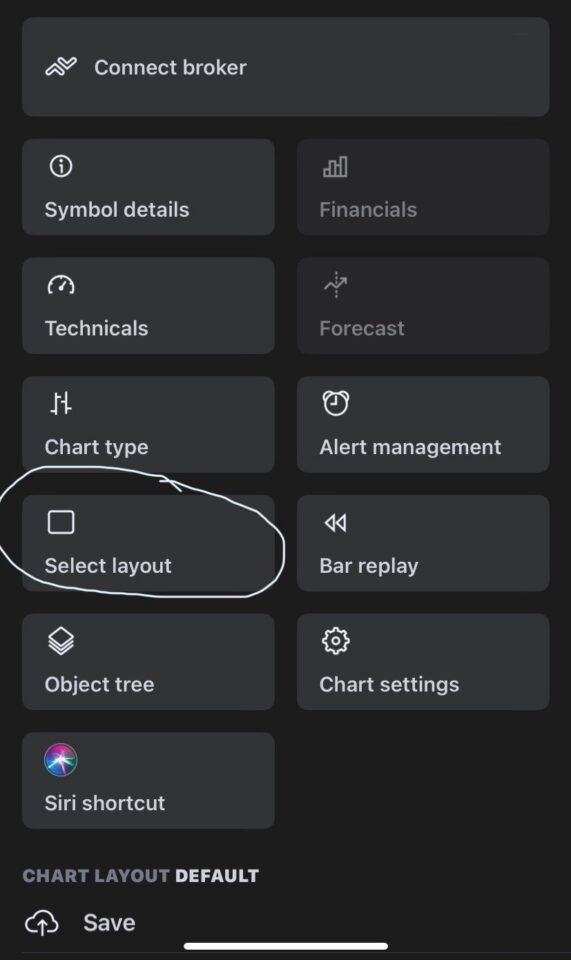
To change the chart layout in the TradingView mobile app, you need to:
Tap on the chart icon at the bottom of the screen
Tap on the three dots at the bottom right corner
Tap select layout
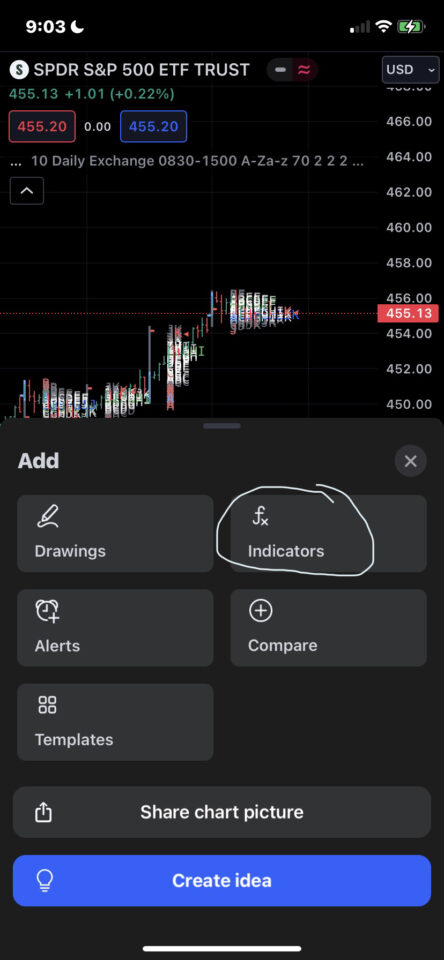
How to Add Indicators on the TradingView Mobile App
To add indicators in the TradingView mobile app, you need to:
Tap on the chart icon at the bottom of the screen
Tap on the plus icon at the bottom right corner
Tap indicators and select the indicator you want to add
You can search for any indicator by name or category in the search bar. To add an indicator to the chart, simply tap on it, and it will appear on the chart. You can also edit or remove indicators by tapping on them again.
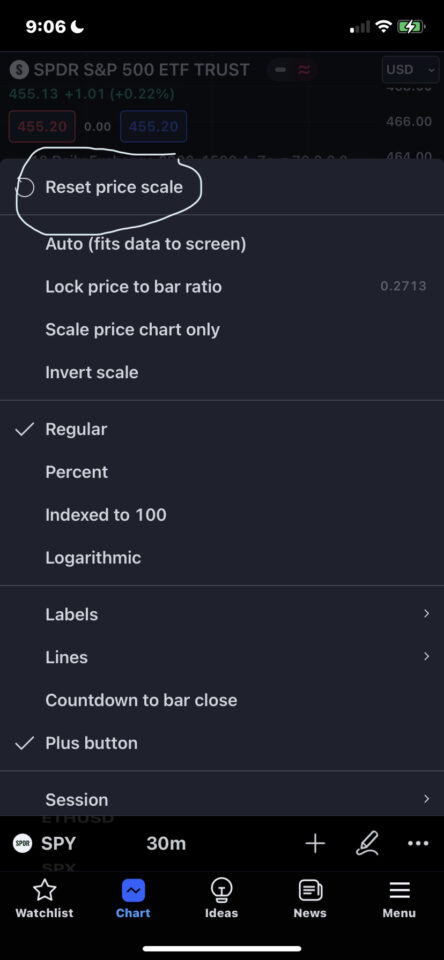
How to Reset Your Chart on the TradingView Mobile App
To reset the chart on the TradingView mobile app, you need to:
Tap on the chart icon at the bottom of the screen
Tap on the gear icon at the bottom right corner
Tap reset price scale
How to Add a Script on the TradingView Mobile App
Currently, you cannot use the Pine editor to add scripts in the TradingView mobile app.
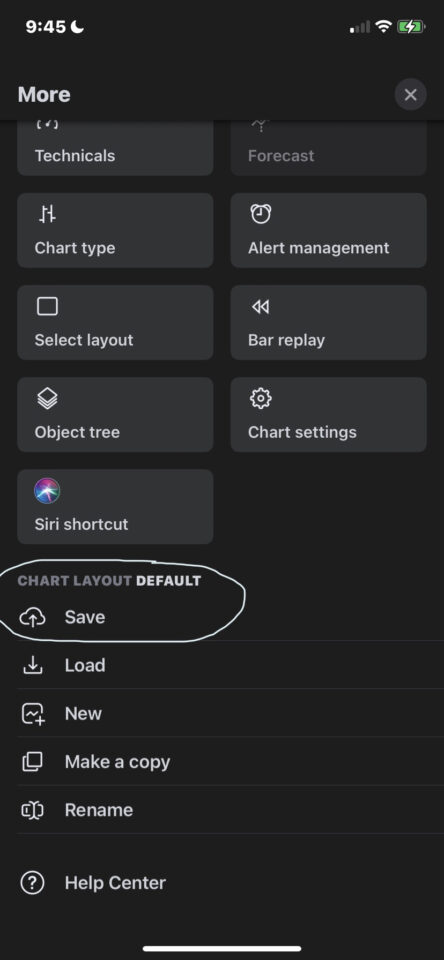
How to Save Charts on the TradingView Mobile App
To save charts on the TradingView mobile app, you need to:
Tap on the chart icon at the bottom of the screen
Tap on the three dots in the bottom right corner
Scroll down and choose one of these options:
Save: To save your current chart layout
Load: To load a previously saved chart layout
Create new: To create a new chart layout
Make a copy: To make a copy of your current chart layout
Rename: To rename your current chart layout
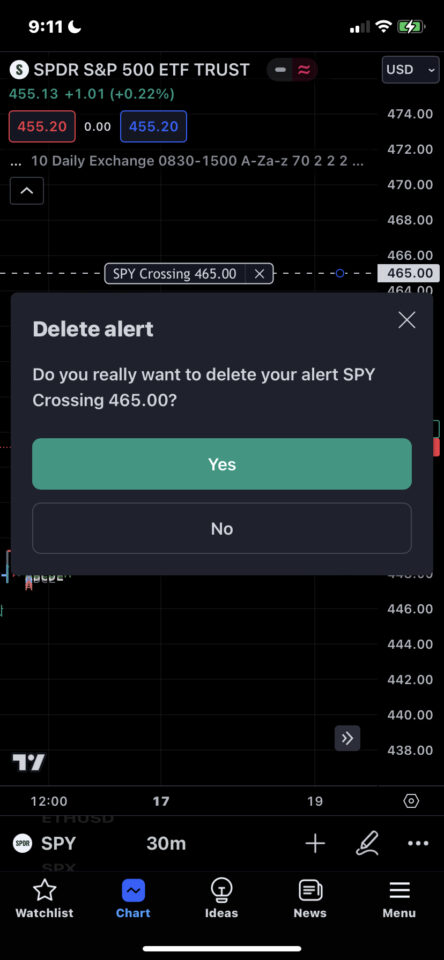
How to Delete Alerts on the TradingView Mobile App
To delete alerts on the TradingView mobile app, you need to:
Go to the symbol with the alert and find it on the chart
Tap it and tap the X
Press yes to delete the alert
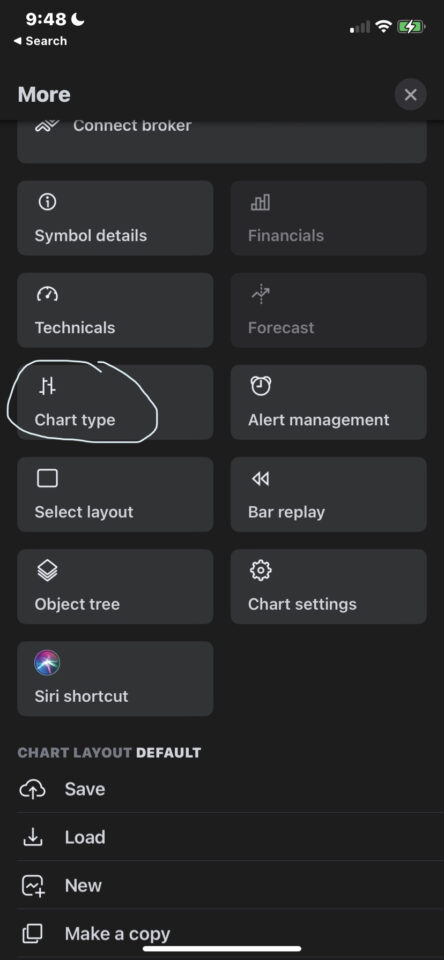
How to Change to Candlesticks on the TradingView App
To change to candlesticks on the TradingView app, you need to:
Tap on the chart icon at the bottom of the screen
Tap on the three dots in the bottom right corner
tap chart type and switch them to candles
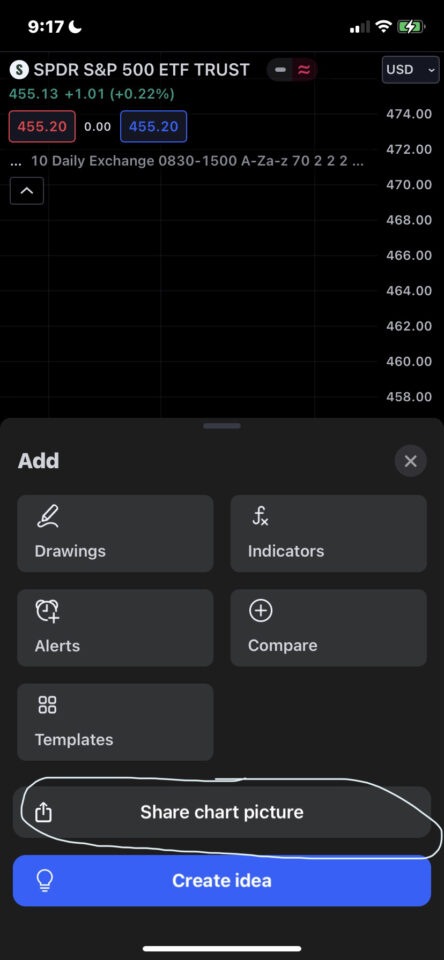
How to Share a TradingView Chart From the App
To share your chart on the TradingView mobile app, you need to:
Make sure you are on the chart tab
Tap the plus icon at the bottom right corner
Tap share chart picture
However, there is not currently a way to share a chart from the TradingView mobile app using a link.
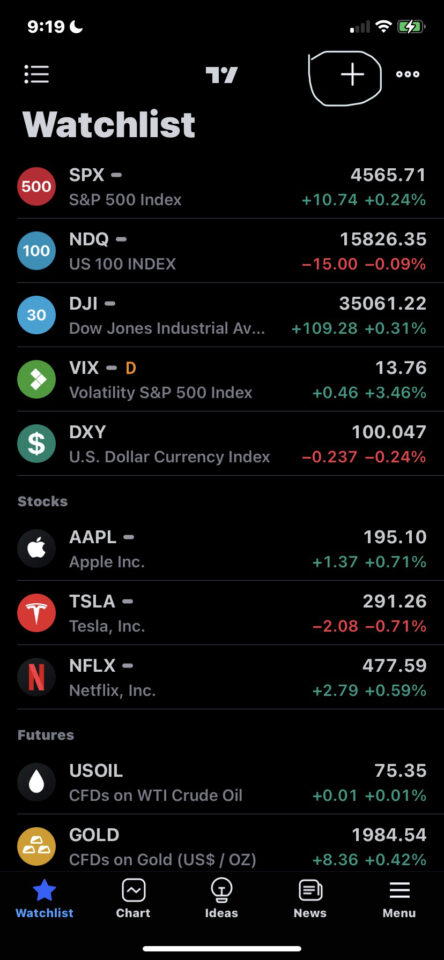
How to Add Symbols to a Watchlist on The Trading View Mobile App
To add a symbol to your TradingView watchlist on the app, you need to:
Tap the watchlist tab in the bottom left corner
Tap the watchlist you want to add to
Tap the plus icon at the top right corner
TradingView Mobile App | Bottom Line
We hope you enjoyed this article and learned something new about the TradingView app. As you can see, the TradingView app is a powerful and convenient way to access the TradingView platform from your mobile device.
TradingView is one of the most popular and powerful web-based platforms for charting, technical analysis, and trading. Whether you are a beginner or an experienced trader, you can benefit from the features and tools that TradingView offers.
In this TradingView tutorial, you will learn how to use TradingView like a pro, from setting up your account and charts to using indicators, alerts, drawing tools, and more.
How to Use TradingView Charts
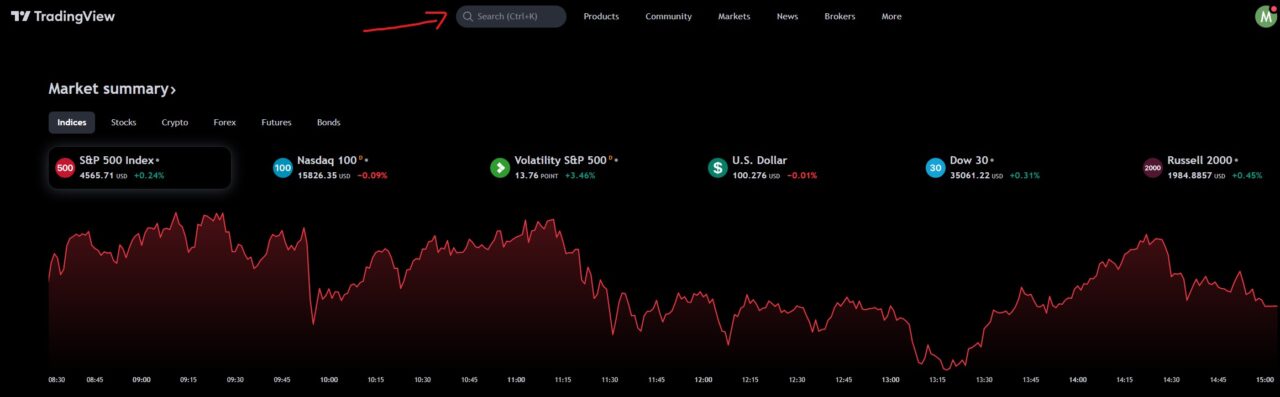
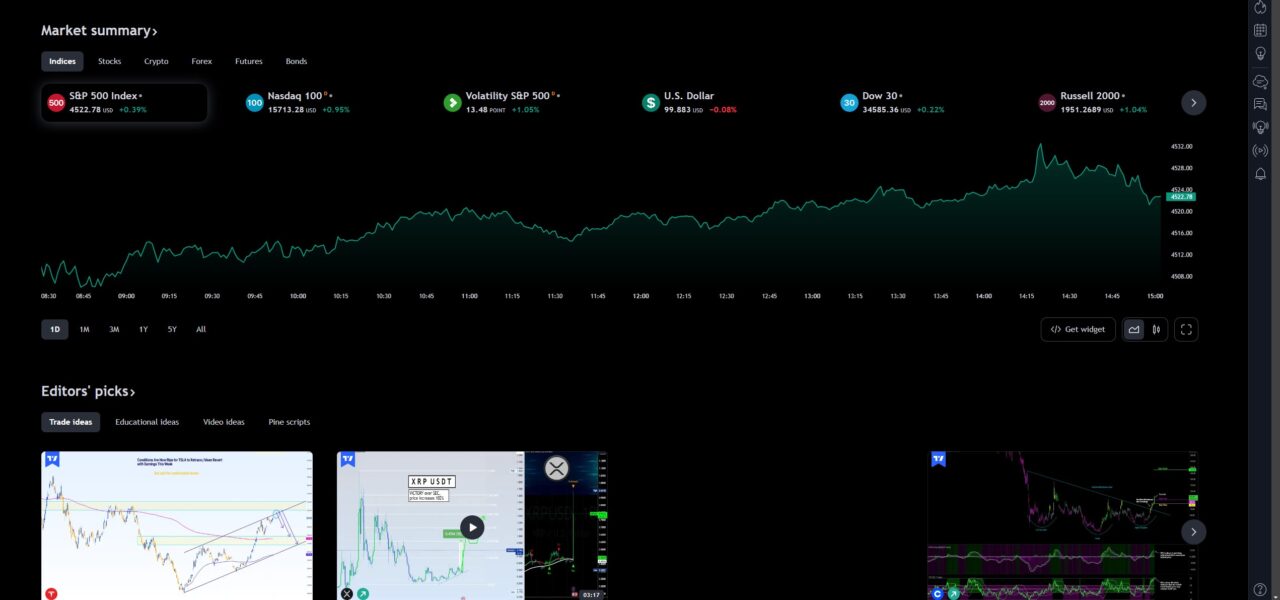
The first step to using TradingView is to create a free account on their website. You can also upgrade to a paid plan for more features and benefits. Once you have an account, you can access the TradingView homepage, where you can see the latest market news, ideas, and charts.
To start using the TradingView chart, you need to type a symbol into the bar at the top of the homepage. You can enter any asset that you want to analyze, such as stocks, forex, cryptocurrencies, commodities, indices, etc. For example, if you want to see the chart of Apple stock, you can type AAPL and click on it.
The chart will open in a new tab, where you can customize it according to your preferences. You can change the chart type, time frame, layout, colors, and more. You can also add indicators, drawing tools, alerts, and other features that we will explain later in this tutorial.
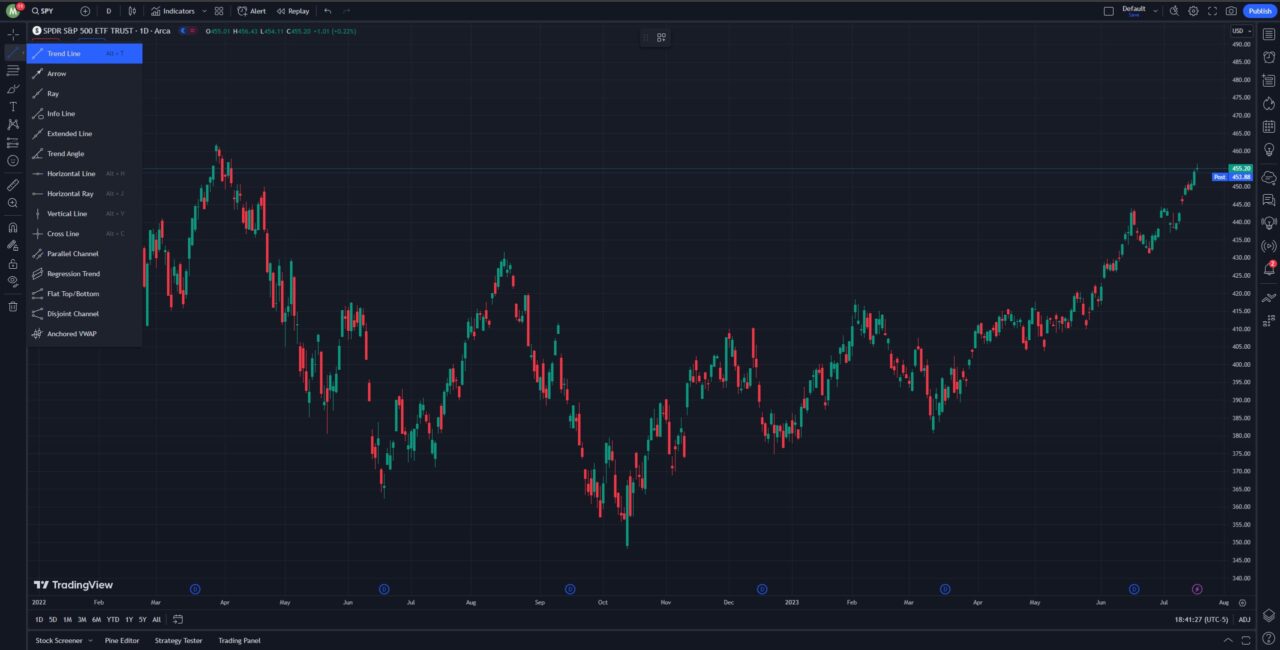
Drawing tools on TradingView
One of the most useful features of TradingView is the drawing tools. These are tools that allow you to mark up your charts with lines, shapes, patterns, text, and other elements. You can use them to identify trends, support and resistance levels, chart patterns, Fibonacci retracements, and more.
To access the drawing tools on TradingView, you need to click on the icon on the left-hand side of the screen that looks like a line. This will open a menu with different categories of drawing tools, such as trend lines and channels. You can select any tool that you want to use and click on the chart to apply it.
You can also customize the settings of each drawing tool by right-clicking on it and choosing “Settings.” You can change the color, style, thickness, visibility, and other options of each tool. You can also duplicate, lock, hide, or delete any drawing tool by right-clicking on it and choosing the appropriate option.
If you want to learn more about how to draw on TradingView and how to use different drawing tools effectively, you can check out our article on how to draw on TradingView.
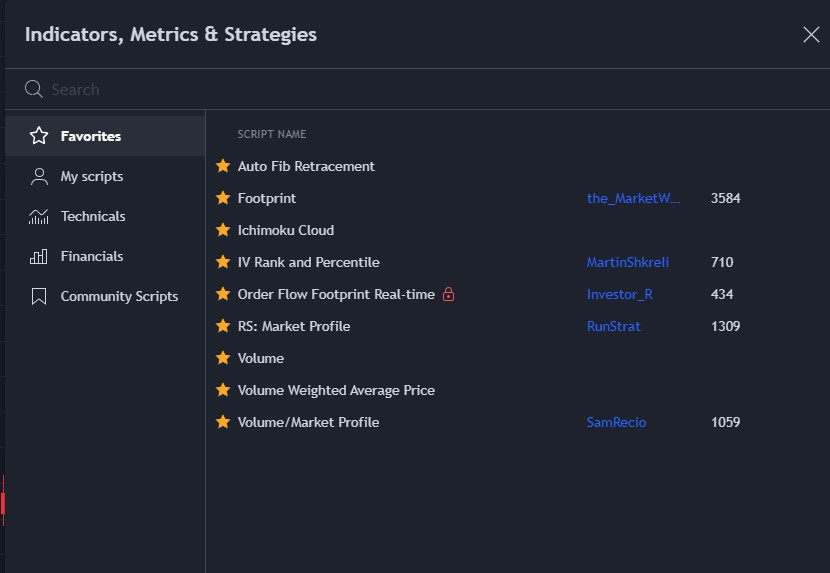
Using Indicators on TradingView
Another powerful feature of TradingView is the indicators. Indicators can help you identify trends, momentum, volatility, volume, and other aspects of the market.
To add indicators to your chart on TradingView, you need to click on the indicators icon at the top of the screen. This will open a menu that allows you to search for all types of indicators, including custom ones built by other traders. Once you find the indicator you want, simply click on it.
The indicator will appear on your chart as a new panel or overlaying the price action. You can customize the settings of each indicator by clicking on its name on the top left corner of its panel or by right-clicking on it and choosing “Settings.”
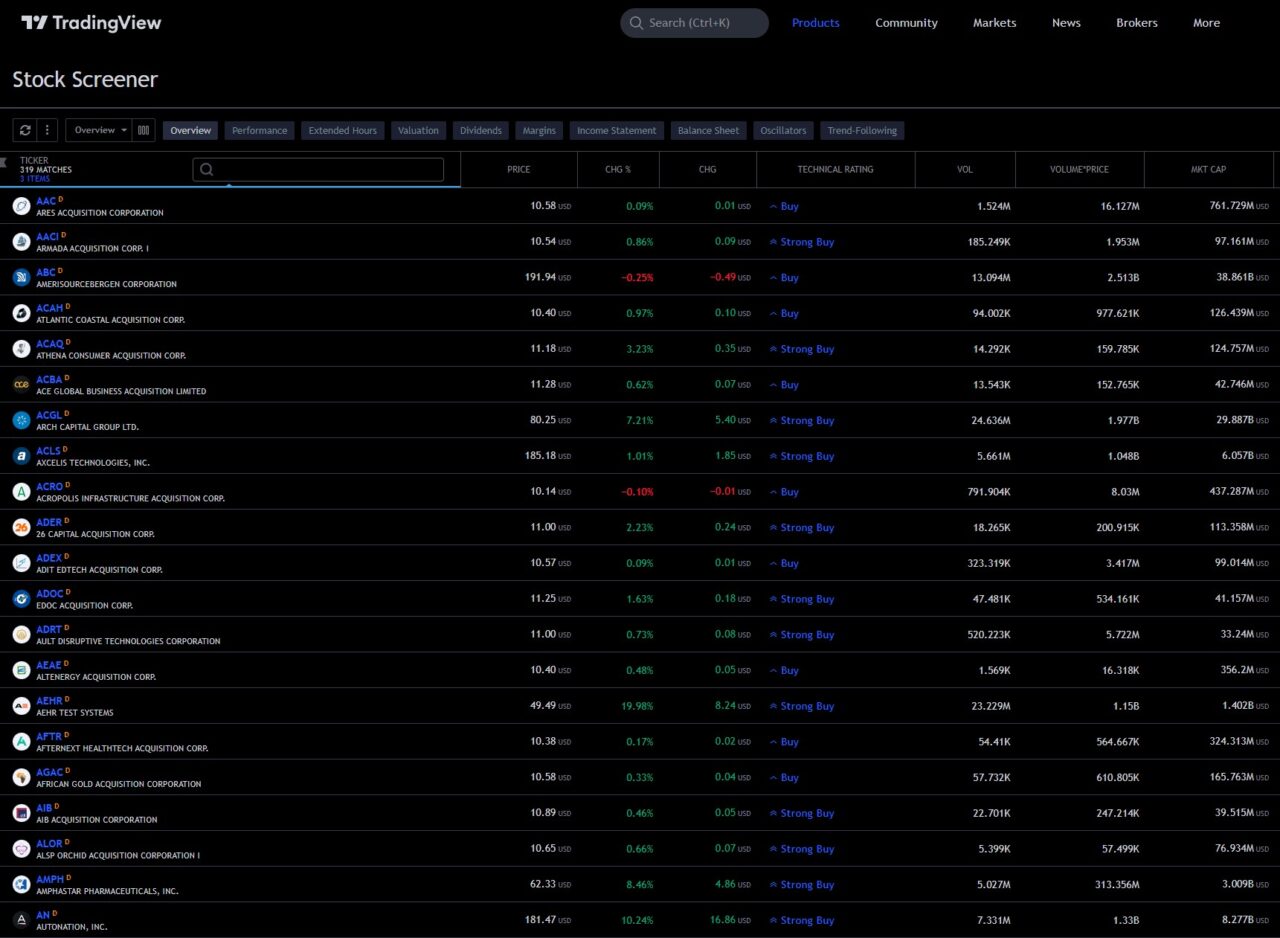
TradingView also offers a stock screener feature that allows you to discover stocks for both trading and investing.
To access the stock screener on TradingView, you can access it from the home page under products -> screeners. Or you can click the stock screener at the bottom left of your chart.
You can filter stocks by price, volume, market cap, dividend yield, P/E ratio, EPS growth, and more. You can also filter stocks by technical indicators and patterns, such as moving averages, RSI, MACD, breakouts, candlestick patterns, and more.
TradingView allows you to connect with brokers to trade directly on the charts. However, many people just use TradingView as a charting platform and trade on a brokerage.
The advantage of trading on TradingView is that you can execute your trades faster and easier without switching between platforms. The disadvantage is that you may have limited options for brokers, fees, and features.
To trade on TradingView, you need to have a paid plan and a supported broker account. You can see the list of supported brokers on the TradingView website.
Once you have connected your broker account, you can start trading on TradingView. Consider our article on the best TradingView brokers to learn more.
How to use TradingView for Cryptocurrency
TradingView also supports cryptocurrency charts, which you can view and analyze the same way as stocks and forex. However, there are some differences and options that you need to be aware of when using TradingView for cryptocurrency.
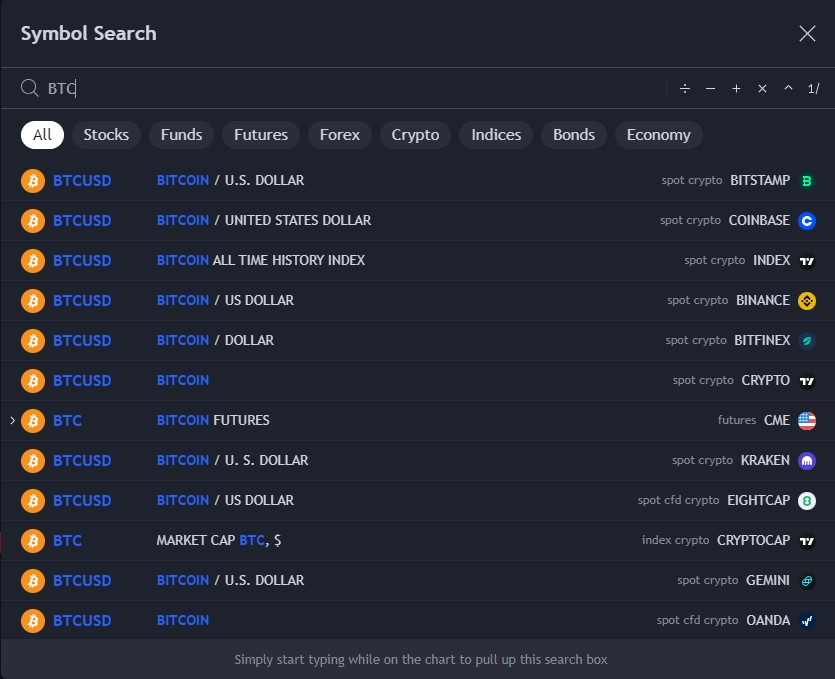
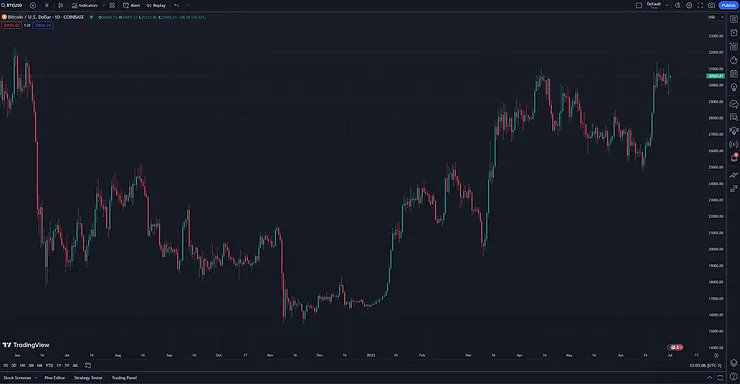
One of the main differences is that you can choose from different exchanges that offer cryptocurrency trading. For example, if you want to see the chart of Bitcoin, you can type BTCUSD and choose from various exchanges, such as Coinbase, Binance, Bitfinex, etc. Each exchange may have different prices, volumes, liquidity, fees, etc., so it is important to pick the one that suits your needs and preferences.
Another difference is that you can view cryptocurrency charts in different currencies, such as USD, EUR, GBP, JPY, etc. For example, if you want to see the chart of Bitcoin in Japanese yen, you can type BTCJPY and choose an exchange that offers this pair.
Apart from these differences, you can use TradingView for cryptocurrency in the same way as for other assets. You can add indicators, drawing tools, alerts, and other features to your cryptocurrency charts. You can also trade cryptocurrencies on TradingView if your broker supports them.
How to use TradingView for Day Trading
TradingView is also a great platform for day trading. Day traders use short-term price movements and technical analysis to make profits from intraday market volatility.
To use TradingView for day trading, you should consider using lower time frames for your charts, such as 1-minute or 5-minute intervals. This will allow you to see more details and opportunities in the daily price action.
TradingView offers several indicators that can help you use order flow in your analysis, such as volume profile, footprint charts, and market profile. These indicators display the volume and transactions of buyers and sellers at different price levels and time intervals.
They can help you see where the most trading activity occurs, where the market is balanced or imbalanced, where the market is likely to move or stall, etc. The volume profile is an advanced TradingView indicator that requires a premium subscription to use, so consider signing up for a free trial to test it out.
If you want to learn more about how to use order flow indicators on TradingView and how to interpret them effectively, you can check out these articles:
TradingView is a versatile and powerful platform that can help you improve your trading performance and results. It offers a wide range of features and tools that can help you analyze any asset in any market. You can customize your charts, add indicators, use drawing tools, set up alerts, trade directly on the charts, and more.
In this TradingView tutorial, we have covered the basics of how to use TradingView for different purposes and styles of trading. However, there is much more to learn and explore on TradingView. You can check out our website for more tips, tutorials, and ideas.
If you want to start using TradingView today, you can sign up for a free trial using our affiliate link. You will get access to all the features and benefits of TradingView for 30 days without any risk or obligation. You can also upgrade to a paid plan for more features and benefits at any time.
FAQ
Is TradingView good for beginners?
TradingView is a great platform for beginners who want to learn how to analyze and trade the financial markets. TradingView offers a user-friendly interface, a wide range of features and tools, a supportive community, and a free plan that allows you to access most of the functionalities.
Can you use TradingView without a broker?
Yes, you can use TradingView without a broker if you just want to use it as a charting and analysis platform. You can access thousands of markets and assets, add indicators and drawing tools, set up alerts, and share your ideas with the TradingView community.
TradingView and MT4 are both trading platforms that allow you to access the forex market, but they are not brokers. You still need to open an account with a broker that supports these platforms and execute your trades through them.
However, these platforms are not exactly the same. They have different features, advantages, and disadvantages that you should consider before choosing one over the other. In this article, we will mainly focus on the charting features of TradingView and MT4.
MT4 itself is free and connects with several forex brokers
Supports advanced automated trading with MQL4 for creating, testing, and optimizing trading bots
More than 30 built-in indicators plus thousands of custom indicators
TradingView Overview
TradingView is a web-based charting platform that was launched in 2011. It has quickly become one of the most popular and widely used charting tools among traders of all levels and markets. TradingView offers more than just forex trading; you can also access stocks, futures, cryptocurrencies, and other instruments on its platform.
TradingView has a modern and user-friendly interface that allows you to customize your charts with various tools, indicators, drawing tools, and timeframes. You can also access a large community of traders who share their ideas, strategies, and analysis on the platform.
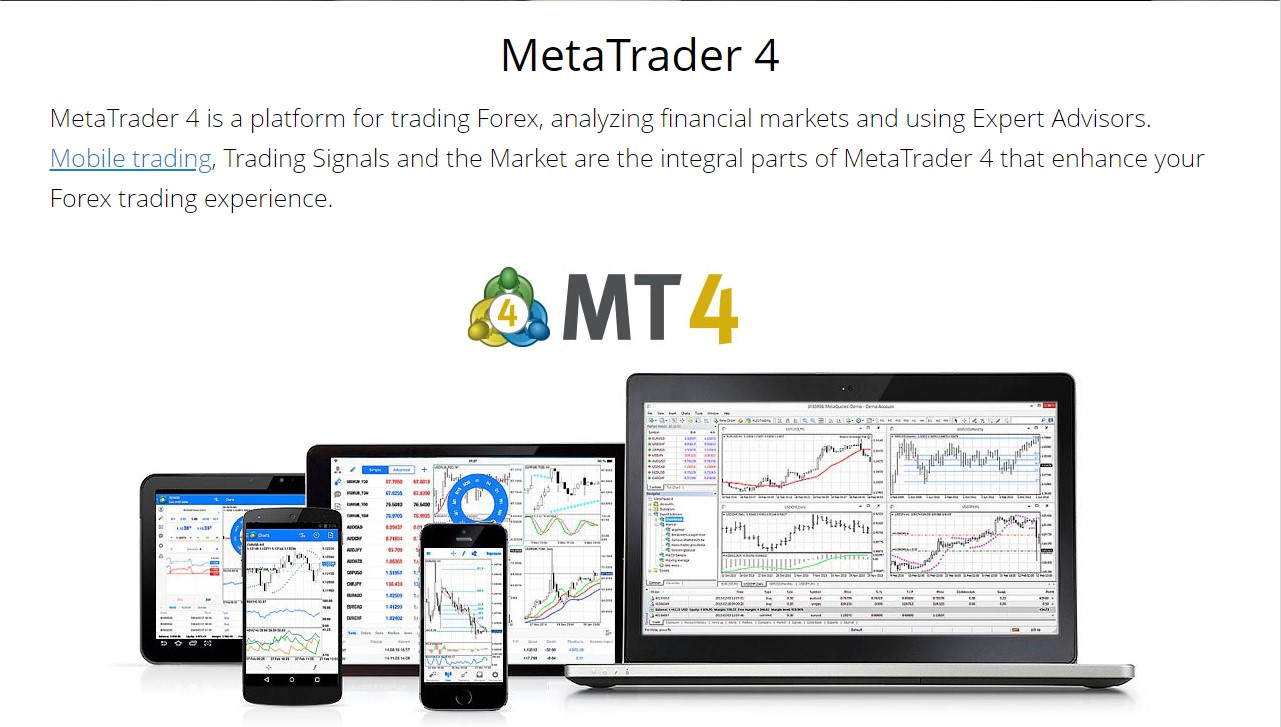
MT4 is a downloadable software platform that was launched in 2005 by MetaQuotes. It is one of the oldest and most widely used trading platforms in the forex industry. MT4 is designed specifically for forex trading, and it offers both trading and analytical features.
MT4 has a simple and customizable interface that allows you to create your own charts with various technical analysis tools, indicators, scripts, and expert advisors (EAs). You can also backtest your strategies and optimize your parameters on the platform.
30 built-in indicators plus the ability to use thousands of custom indicators.
Ability to backtest using the strategy tester and trading bots.
No stock screeners are available.
Supports brokers, including Oanda, Forex.com, FXCM, and more.
Free trading robots, expert advisors (EA), mobile trading
TradingView Pros & Cons
Pros
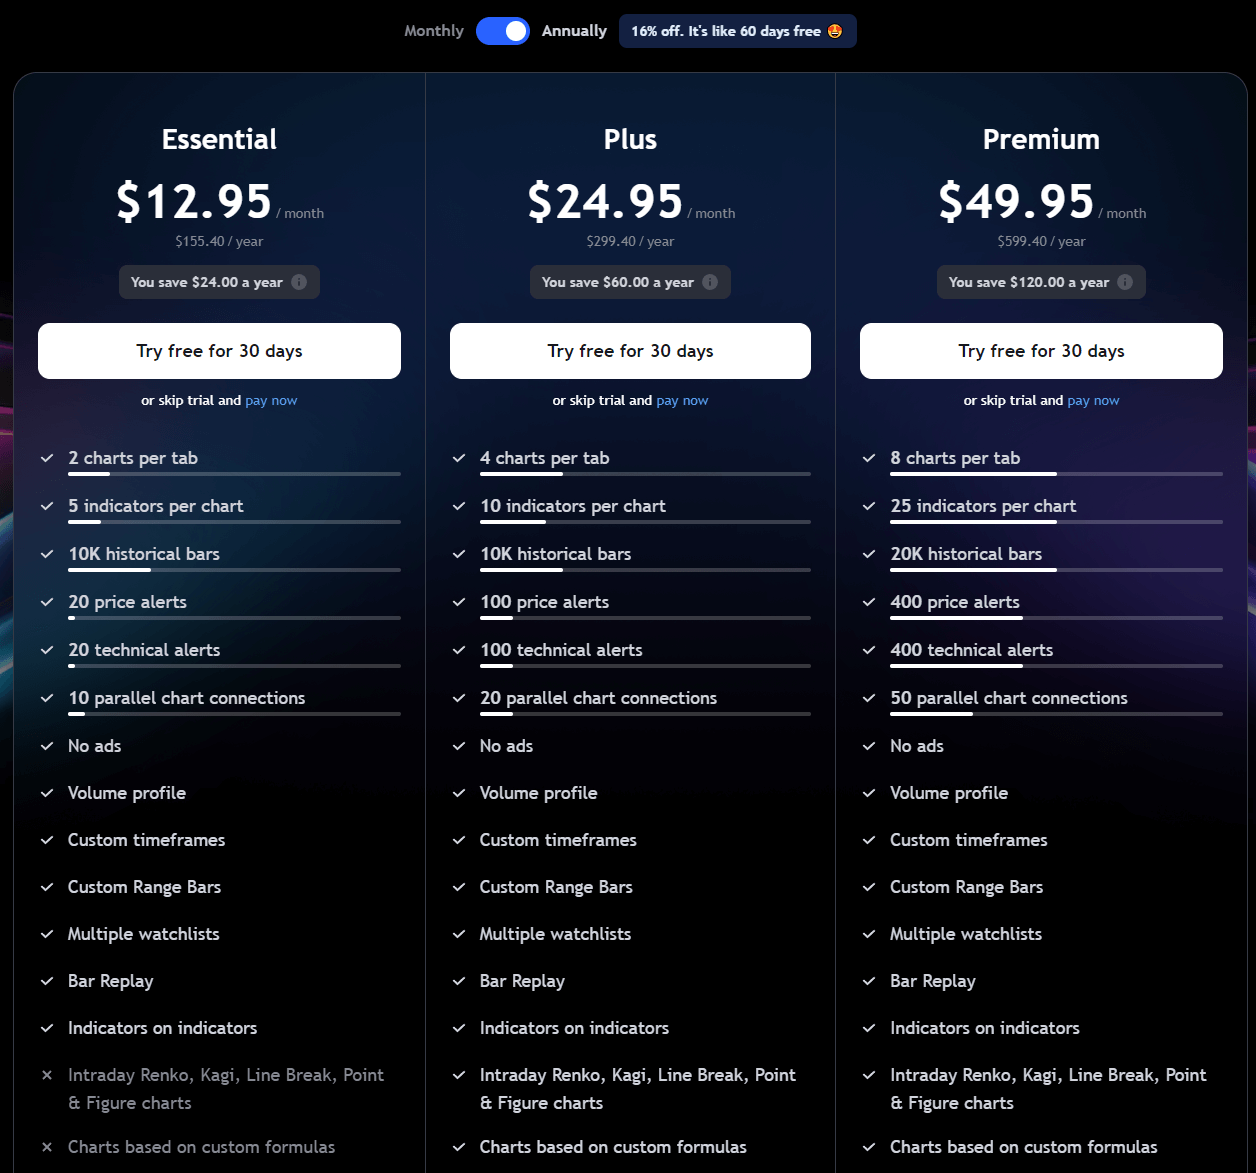
TradingView is free to use and sign up. However, if you want to unlock more advanced features, such as more indicators, alerts, multiple charts per layout, etc., you can upgrade to one of its paid plans: Essential, Plus, or Premium.
TradingView offers a free trial to test all of its premium features for 30 days. You can cancel anytime if you are not satisfied with the service.
TradingView has a wide range of instruments that you can trade on its platform. You can access more than just forex; you can also trade stocks, futures, cryptocurrencies, commodities, indices, bonds, CFDs, and more.
TradingView has a modern and intuitive interface that makes it easy to use and navigate. You can customize your charts with various tools, indicators, drawing tools, timeframes, layouts, themes, etc.
TradingView has more advanced charting tools and indicators than MT4. You can access over 100 built-in indicators, including some unique ones created by TradingView users. You can also create your own indicators using Pine Script, a programming language designed for TradingView.
MT4 is free to download and use. However, you will need to open an account with a broker that supports MT4 and execute your trades through them.
MT4 is reliable and stable. It has been around for a long time and has proven its performance and functionality in the forex market. It rarely crashes or freezes, and it can handle high volumes of data and orders.
MT4 supports automated trading. You can use EAs to automate your trading strategies and execute them on the platform. You can also backtest your EAs and optimize your parameters on the platform.
Cons
MT4 is outdated and limited. It has not been updated or improved much since its launch in 2005. It lacks some of the features and tools that modern traders need, plus it looks old.
MT4 has a lack of instruments. It only supports forex trading, and it does not offer access to other markets or instruments, such as stocks, futures, cryptocurrencies, etc.
MT4 has a lack of chart timeframes compared to TradingView. On MT4, you can only access nine standard timeframes: M1, M5, M15, M30, H1, H4, D1, W1, and MN. On TradingView, you can access more than 20 timeframes, including custom ones, such as M2, M3, M10, H2, H8, etc. You can also access tick charts on TradingView, which show every price movement in the market.
MT4 has a lack of indicators compared to TradingView. On MT4, you can only access about 30 built-in indicators, and some of them are outdated or redundant. On TradingView, you can access over 100 built-in indicators, including some unique ones created by TradingView users. You can also create your own indicators using Pine Script, a programming language designed for TradingView.
MT4 has an outdated and complex interface that makes it hard to use and navigate. You may need to spend some time and effort to learn how to use the platform and customize it to your preferences.
TradingView vs MT4 – Bottom Line
TradingView and MT4 are both popular and widely used trading platforms for forex traders. However, they have different features, advantages, and disadvantages that you should consider before choosing one over the other.
TradingView is a web-based charting platform that offers more advanced charting tools and indicators than MT4. It also offers access to more instruments and markets than MT4. It has a modern and user-friendly interface that makes it easy to use and navigate. It also has a large and active community of traders who share their ideas and analysis on the platform.
MT4 is a downloadable software platform that offers both trading and analytical features for forex trading. It is reliable and stable, and it supports automated trading with EAs. It is customizable and flexible, and it supports multiple languages and platforms. However, it is outdated and limited in terms of charting tools, indicators, timeframes, and instruments.
Ultimately, the best platform for you depends on your personal preferences, trading style, and goals. However, it is clear that TradingView is a better all around trading and charting platform.
If you want to try TradingView for yourself and see how it compares to MT4, you can sign up for a free account here and get a free trial of TradingView. When you use my affiliate link, you will also get a discount on your membership!
I hope this article has helped you understand the differences between TradingView and MT4 charting tools and make an informed decision on which one is best for you.
TradingView is a web-based platform that combines multi-asset charting, screening, backtesting, and trading. TradingView covers stocks, bonds, forex, commodities, indices, and cryptocurrencies, making it suitable for traders and investors of different markets and styles. TradingView also integrates with several brokers, allowing you to trade directly from the charts with real-time data and execution.
TradingView has a freemium model, meaning you can use some of its features for free, but you need to upgrade to a paid plan to access more advanced tools and functionalities.
TradingView offers four subscription plans: Basic (free), Essential ($14.95/month), Plus ($29.95/month), and Premium ($59.95/month). The main differences between the plans are the number of indicators, alerts, charts, watchlists, and devices you can use simultaneously, as well as the availability of features like extended trading hours, custom intervals, intraday data, volume profile indicators, priority customer support, and more.
Overview of TC2000
TC2000 is a desktop-based platform that specializes in stock and options charting, scanning, and trading. It was created by Worden Brothers in 1993 and has won several awards for its software quality and customer service. TC2000 covers US and Canadian stocks and options, as well as some ETFs and mutual funds.
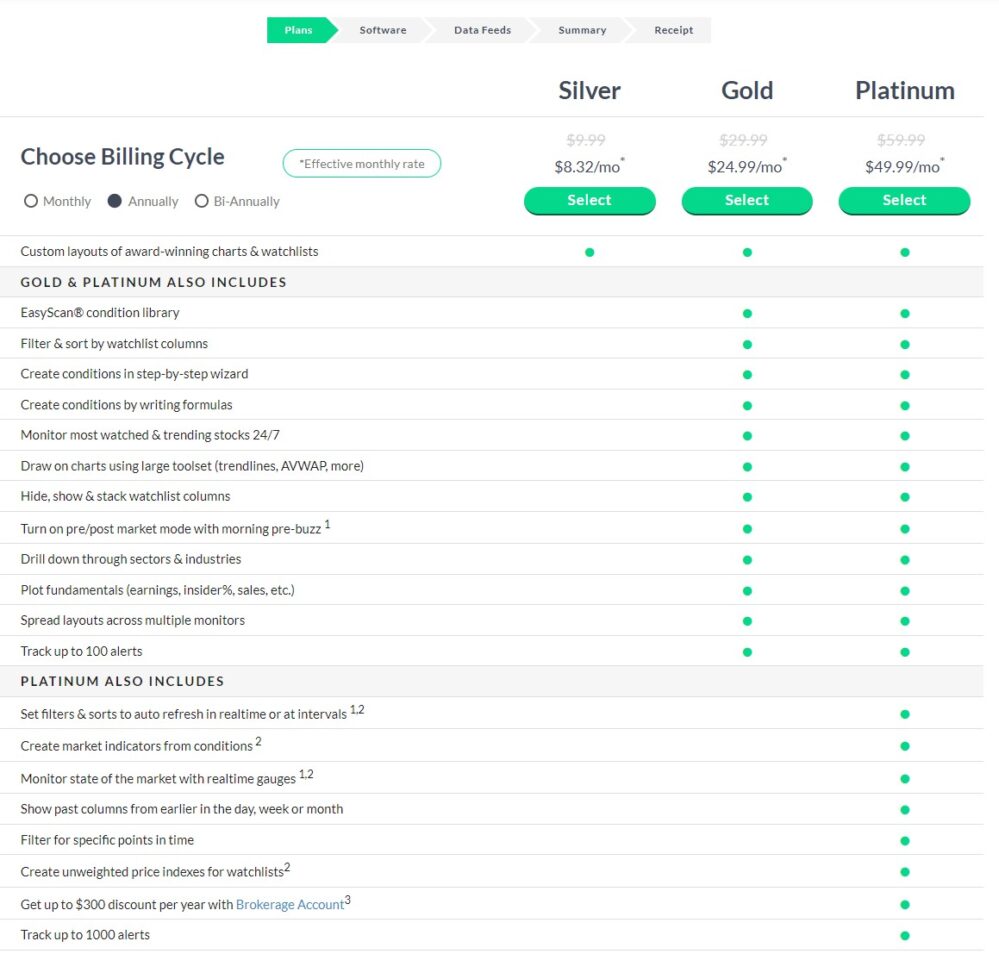
TC2000 has a subscription-based model, meaning that you need to pay a monthly or annual fee to use the platform. TC2000 offers three subscription plans: Silver ($9.99/month), Gold ($29.99/month), and Platinum ($89.99/month). You will get a discount if you purchase an annual subscription. TC2000 also still charges a fee for each stock and option trade you make.
$0-$59.95 per month + free trial with my affiliate link
$8-$50 per month + $25 off with my affiliate link
Assets and Markets
Stocks, bonds, forex, commodities, indices, and cryptocurrencies from around the world
US and Canadian stocks and options, as well as some ETFs and mutual funds
Charting
Hundreds of indicators, drawing tools, and chart types; custom intervals; volume profile indicators; Pine Script for creating custom indicators and strategies
Hundreds of indicators, drawing tools, and chart types; standard intervals; PCF for creating conditions and formulas
Screening
Predefined filters and indicators; Pine Script for creating custom screens
Custom conditions and formulas using PCF; EasyScan for scanning multiple watchlists and conditions simultaneously
Trading
Supports multiple brokers that offer commission-free or low-cost trading for different assets; paper trading feature
Charges $1 + $0.005 per share and $1 + $0.65 per contract for options
Backtesting
Pine Script for creating and backtesting strategies; detailed report with performance metrics, trades list, equity curve, drawdowns, etc.; optimization feature
PCF for creating and backtesting strategies; detailed report with number of trades, win rate, average gain/loss, maximum drawdown, etc.; optimization feature
TradingView and TC2000 have many features in common, but they also have some significant differences that may affect your choice depending on your trading goals and preferences. Here are some of the main features that distinguish these two platforms:
Assets and Markets
TradingView covers a wider range of assets and markets than TC2000. TradingView supports stocks, bonds, forex, commodities, indices, and cryptocurrencies from around the world, while TC2000 only supports US and Canadian stocks and options, as well as some ETFs and mutual funds. This means that if you want to trade or invest in other markets or assets than stocks and options, TradingView may be a better option for you.
Charting
Both platforms offer excellent charting capabilities, with hundreds of indicators, drawing tools, and chart types to choose from. However, TradingView has some advantages over TC2000 in terms of charting. For example,
TradingView allows you to create custom intervals, such as 2-minute or 7-hour charts, while TC2000 only offers standard intervals, such as 1-minute or 1-day charts. TradingView also supports footprint and market profile charts, which show the distribution of volume at different price levels, while TC2000 does not.
Screening
Both platforms have powerful screening tools that allow you to scan the market for stocks and options that meet your criteria. However, TC2000 has some advantages over TradingView in terms of screening. You can read my full article about the TradingView stock screener for more information.
For example, TC2000 allows you to create custom conditions and formulas using PCF, while TradingView only lets you use predefined filters and indicators. TC2000 also has a feature called EasyScan, which lets you scan multiple watchlists and conditions simultaneously and see the results in real-time.
TradingView does not have a similar feature. Moreover, TC2000 has a feature called Options Scanner, which lets you scan the market for options strategies that meet your criteria, such as covered calls, naked puts, bullish spreads, etc. TradingView does not have a similar feature.
Backtesting
TradingView has a clear edge over TC2000 in terms of backtesting. TradingView allows you to backtest your strategies using Pine Script and see the results in a detailed report that shows the performance metrics, trades list, equity curve, drawdowns, etc. You can also optimize your strategies using different parameters and see how they affect the results. TC2000 also allows you to backtest your strategies using PCF, but the results are more limited and less informative than TradingView’s. You can only see the number of trades, win rate, average gain/loss, maximum drawdown, etc. You cannot optimize your strategies or see the equity curve or trades list.
Trading
Both platforms allow you to trade directly from the charts using real-time data and execution. However, TradingView has some advantages over TC2000 in terms of trading. For example, TradingView supports multiple brokers, such as TradeStation, Oanda, Interactive Brokers, Webull, etc. This means that you have more choices and flexibility when it comes to choosing a broker with TradingView.
TC2000 itself is a broker, but it does not offer free equity trading like most modern brokers. TradingView also supports trading stocks, forex, futures, and crypto globally, while TC2000 only supports trading stocks and options in the US and Canada. Moreover, TradingView has a feature called Paper Trading, which lets you practice your trading skills and strategies with virtual money and real-time data. TC2000 does not have a similar feature.
Usability
Both platforms are easy to use and have intuitive and user-friendly interfaces. However, TradingView has some advantages over TC2000 in terms of usability. For example, TradingView is web-based, meaning that you can access it from any device and browser without downloading or installing anything. TC2000 is desktop-based, meaning that you need to download and install it on your PC or Mac.
TradingView also has a mobile app for iOS and Android devices, while TC2000 does not. Moreover, TradingView has a feature called Social Network, which lets you interact with other traders and investors from around the world. You can share your charts and ideas, follow other users, comment on their posts, join groups and chat rooms, etc. TC2000 does not have a similar feature.
TradingView vs. TC 2000 Charting
Both TradingView and TC2000 offer excellent charting capabilities, with hundreds of indicators, drawing tools, and chart types to choose from. However, TradingView has some advantages over TC2000 in terms of charting that make it superior.
First of all, TradingView allows you to create custom intervals, such as 2-minute or 7-hour charts, while TC2000 only offers standard intervals, such as 1-minute or 1-day charts. Custom intervals can help you fine-tune your analysis and trading according to your preferred time frame and style.
Secondly, TradingView supports volume profile indicators, which show the distribution of volume at different price levels. Volume profile indicators can help you identify areas of support and resistance, as well as gauge the strength and weakness of price movements. TC2000 does not support volume profile indicators.
TradingView vs. TC2000 Pricing
Both TradingView and TC2000 have similar pricing ranges, but TradingView offers more value for money than TC2000.
TradingView has a freemium model, meaning that you can use some of its features for free, but you need to upgrade to a paid plan to access more advanced tools and functionalities.
TradingView offers four subscription plans: Basic (free), Essential ($14.95/month), Plus ($29.95/month), and Premium ($59.95/month). The main differences between the plans are the number of indicators, alerts, charts, watchlists, and devices you can use simultaneously, as well as the availability of features like extended trading hours, custom intervals, intraday data, volume profile indicators, priority customer support, and more.
TC2000 has a subscription-based model, meaning that you need to pay a monthly or annual fee to use the platform. TC2000 offers three subscription plans: Silver ($9.99/month), Gold ($29.99/month), and Platinum ($89.99/month).
TC2000 Pricing
Another thing to consider is the trading commissions. Some of the brokers that TradingView supports offer commission-free trading for stocks and ETFs and low fees for options and other assets. For example, TradeStation charges $0 per trade for stocks and ETFs and $0.50 per contract for options.
On the other hand, TC2000 charges $4.95 per trade for stocks and ETFs and $2.95 plus $0.65 per contract for options. This means that if you trade frequently or in large volumes, TradingView may save you a lot of money in commissions compared to TC2000.
Both TradingView and TC2000 are excellent platforms that offer advanced charting, screening, and trading features. However, TradingView is clearly superior based on pricing and charting.
TradingView offers free plans and a wide range of brokers you can trade from that charge much lower fees than TC2000. Additionally, if you want to trade or invest in other markets or assets than stocks and options, such as forex, commodities, or cryptocurrencies, TradingView may be a better option for you.
TradingView is also better If you want to backtest and optimize your strategies using a simple and user-friendly programming language. TradingView has a feature called Pine Script, which lets you create your own indicators and strategies using a simple programming language.
You can also backtest and optimize your strategies using different parameters and see how they affect the results. TC2000 also has a scripting language called PCF (Personal Criteria Formula), but it is less user-friendly than Pine Script.
How to Get a TradingView Free Trial
If you are interested in trying out TradingView for yourself, you can sign up for a free trial using my affiliate link. You will get access to all the features and functionalities of the platform for 30 days. You can also cancel your subscription at any time if you are not satisfied with the service.
Q: What is the difference between TradingView and TC2000?
A: TradingView is a charting platform, while TC2000 is a brokerage. However, you can connect some brokers to trade directly on TradingView.
Q: Is TC2000 good for day trading?
A: TC2000 can be a good platform for day trading stocks and options in the US and Canada, as it offers one of the best live trading platforms available anywhere.
Q: Is TradingView the best charting tool?
A: TradingView is widely regarded as one of the best charting tools in the industry, offering hundreds of indicators, drawing tools, and chart types to choose from.
Q: Do you need a broker with TradingView?
A: TradingView is not a standalone broker, meaning that you cannot trade directly with TradingView without connecting to a broker. TradingView supports multiple brokers that offer trading for different assets and markets. However, you do not need one to use the charting, backtesting, or screener.
Q: Can I backtest on TC2000?
A: TC2000 allows you to backtest your strategies using PCF (Personal Criteria Formula), a scripting language that lets you create custom conditions and formulas. You can apply your PCF to any watchlist or scan it and see how it performed in the past.
However, TC2000’s backtesting capabilities are more limited and less informative than other platforms, such as TradingView. You can only see the number of trades, win rate, average gain/loss, maximum drawdown, etc. You cannot optimize your strategies or see the equity curve or trades list.
Q: Is TC2000 screener free?
A: TC2000 screener is not free. You need to pay a monthly or annual fee to use the platform and access its screening features.
Before you go
If you want to keep educating yourself about trading, you must check out these posts as well:
TradingView and Coinigy are two popular platforms used by traders to trade and perform technical analysis. In this article, we will compare TradingView and Coinigy to help you decide which platform is better for you.
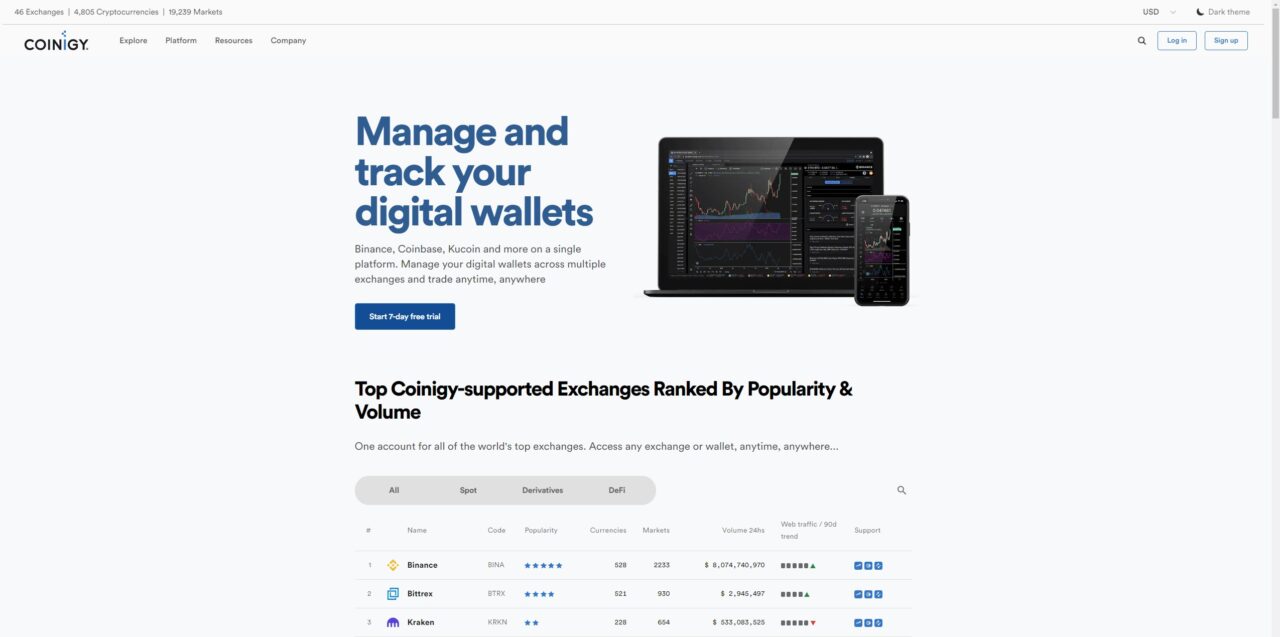
46 crypto exchanges, 19,239 markets, and 4,805 cryptocurrencies
Real-time API and 3rd party integrations
Overview of TradingView and Coinigy
TradingView
TradingView is a platform designed to provide real-time information and market insights for stocks, crypto, forex, and more. It is a charting and trading platform where you can gain access to some of the best technical analysis tools and several markets all in one platform.
Coinigy, on the other hand, mainly focuses on crypto trading. They were catapulted to the top of the industry by the cryptocurrency wave that swept across the world just a few years ago. The team behind this service seems focused on introducing a paradigm shift in the global financial industry.
User Interface and Design
TradingView
TradingView has a highly intuitive user interface that makes it easy for users to navigate the platform. They also provide amazing heatmaps you can use for free. Additionally, TradingView is completely free to use if you just want charting. There are tons of free indicators you can use, and some advanced paid indicators you must have a subscription for as well.
Coinigy
Coinigy also has a user-friendly interface that allows traders to manage several accounts at more than a dozen cryptocurrency exchanges through a single app.
Charting and Technical Analysis Tools
TradingView
When it comes to charting tools, TradingView seems to have an upper hand with its HTML5 charts. The charts pack more than 50 intelligent drawing tools, and users can choose from many different chart types ranging from spread charts, line break, KAGI, and RENKO to PNF charts. Users can even adjust the system to accommodate multiple chart layouts or have multiple symbols on the chart.
Coinigy
Users can trade directly from the charting platform of their favorite exchanges with Coinigy. The platform has more than 45 exchanges so far and access to more than 75 technical indicators.
Coinigy allows you to access a real-time API, volume alerts, and use various third-party integrations. Coinigy also allows traders to access and chart 46 crypto exchanges, 19,239 markets, and 4,805 cryptocurrencies all from a single app.
Mobile Experience
Both TradingView and Coinigy have mobile apps available for users. However, the TradingView app is a bit easier to use and allows you to track stocks, crypto, forex, and more.
Pricing and Plans
TradingView offers a free plan as well as paid plans ranging from $12.95 to $59.95 per month. You can also get a free trial and a discount on your TradingView subscription using our affiliate link! Coinigy offers a free 30-day trial followed by a monthly subscription fee from $18 to $99 per month, depending on the current deals.
Both TradingView and Coinigy are great platforms for traders. TradingView seems to have an upper hand when it comes to charting tools, while Coinigy offers more options for trading cryptocurrencies. Ultimately, the choice between the two platforms will depend on your individual needs as a trader.
Before you go
If you want to keep educating yourself about personal finance, you must check out these posts as well:
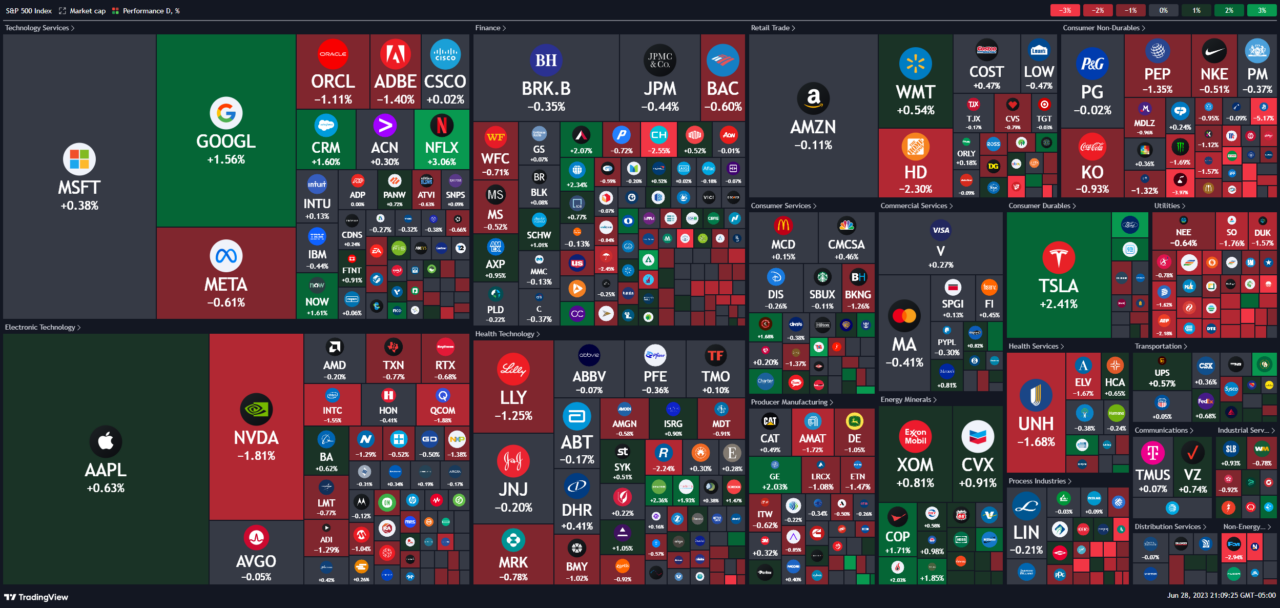
The TradingView heatmap is a powerful tool that visualizes market data in an intuitive way. TradingView offers a stock, crypto, and forex heatmap, and they are some of the best available online.
TradingView Heatmap Introduction
One of the most popular and useful data visualization tools for traders is the TradingView heatmap. The heat map shows the performance of stocks, forex, and cryptocurrencies in real-time using color-coded cells. TradingView’s heatmaps allow you to:
Compare the performance of different asset classes, sectors, countries, and indicators
Easily determine which sectors are performing better than others
Benefits of the TradingView Heatmap
The TradingView heatmap has many benefits for traders, such as:
It helps you quickly identify the market sentiment and the direction of the price movements. You can see at a glance which assets are rising or falling, which sectors or countries are outperforming or underperforming, and which indicators are bullish or bearish.
You can use the heatmap data to assess your exposure to different markets and factors, such as sector risk, country risk, or indicator risk. You can also use the heatmap data to balance your portfolio by adding or removing assets that complement or hedge your existing positions.
How to Access and Navigate the TradingView Heatmaps?
Here are the links to TradingView’s stock, crypto, and forex heatmaps:
You can also access the TradingView heatmap from the TradingView website or app.
How to Access the TradingView Heatmap on Desktop
Go to the footer, then Products > Heatmaps > Stock or Crypto.
From the homepage, you can also access the heatmap by going to Products > Screeners
How to Access the TradingView Heatmap on Mobile
To access the TradingView heatmap from the mobile app, tap on More > Stock Heatmap or Crypto Coins Heatmap.
How to Interpret and Analyze the TradingView Heatmap?
To interpret and analyze the TradingView heatmap, you need to understand how to read the colors and the cell sizes of the heatmap. The colors indicate the percentage change of the price of each asset over a selected timeframe.
The cell sizes represent the market capitalization or the volume of each asset. The brighter or darker the color, the higher or lower the percentage change. The larger or smaller the cell size, the bigger or smaller the market cap or volume.
To use the TradingView heatmap to identify patterns and trends in the market, you need to look for:
Clusters: These are groups of similar colors or cell sizes that indicate a strong correlation or divergence among assets. For example, a cluster of green cells indicates that a group of assets are rising together, while a cluster of red cells indicates that a group of assets are falling together.
Outliers: These are cells that have a different color or cell size from the rest of the heatmap that indicate a significant deviation or volatility among assets. For example, an outlier with a bright green color indicates that an asset is surging in price, while an outlier with a dark red color indicates that an asset is plunging in price. An outlier with a large cell size indicates that an asset has a high market cap or volume, while an outlier with a small cell size indicates that an asset has a low market cap or volume.
Gradients: These are transitions from one color to another that indicate a gradual change or momentum among assets. For example, a gradient from green to red indicates that an asset is losing its upward momentum and turning bearish, while a gradient from red to green indicates that an asset is gaining its downward momentum and turning bullish.
The main components of the TradingView Heatmap interface are:
The asset selector: This lets you choose between stocks and cryptocurrencies. You can also switch between different indices, such as S&P 500, Dow Jones, Nasdaq 100, etc., for stocks, or different coins, such as Bitcoin, Ethereum, Litecoin, etc., for cryptocurrencies.
The filter menu: This allows you to sort and filter the assets by various criteria, such as index, sector, country, timeframe, performance, volume, market cap, etc.
The heatmap display: This shows the color-coded cells of the assets. You can zoom in or out by using the mouse wheel or pinch gesture. You can also drag the heatmap around by using the mouse click or touch gesture.
The legend: This explains the meaning of the colors and the cell sizes. The colors indicate the percentage change of the price of each asset over a selected timeframe. The cell sizes represent the market capitalization or the volume of each asset. The brighter or darker the color, the higher or lower the percentage change. The larger or smaller the cell size, the bigger or smaller the market cap or volume.
The tooltip: This provides more details about each asset when you hover over it. You can see the name, symbol, price, percentage change, market cap, and volume of the asset. You can also click on the asset to open its chart or add it to your watchlist.
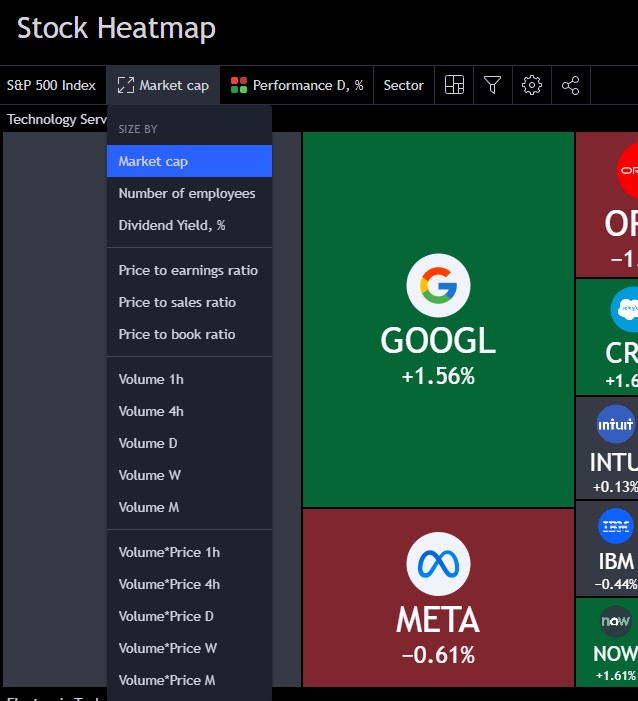
How to Customize and Optimize the TradingView Heatmap?
You can customize the TradingView heatmap to suit your personal preferences and trading goals by changing the following options:
The asset class, index, sector, country, or indicator that you want to analyze. You can choose between stocks and cryptocurrencies, and switch between different indices, sectors, countries, or indicators for each asset class.
The timeframe, performance, volume, or market cap that you want to compare. You can select different timeframes, performance ranges, volume levels, or market cap sizes for each asset class.
The color scheme, intensity level, or cell size ratio that you want to view. You can choose between different color schemes, intensity levels, or cell size ratios for each asset class.
Understanding TradingView’s Heatmaps | Bottom Line
The TradingView heatmap is a powerful data visualization tool that shows the performance of stocks and cryptocurrencies in real-time using color-coded cells. It allows you to:
Quickly identify the market sentiment and the direction of the price movements
Compare the performance of different asset classes, sectors, countries, and indicators
Discover new trading opportunities and potential entry and exit points
Manage your risk and diversify your portfolio
You can access the TradingView heatmap from the TradingView website or app, and customize it to suit your personal preferences and trading goals.
Heatmaps are valuable tools for traders who want to boost their trading performance by visualizing the market data in an intuitive way.
If you want to start using TradingView Heatmap and explore its features and benefits, you can sign up for a free account on TradingView today. New users can usually enjoy a free trial and a discount when they use my link to sign up!
Yes, TradingView has a heat map feature that shows the performance of stocks, forex, and cryptocurrencies in real-time using color-coded cells. You can access TradingView Heatmap from the TradingView website or app and customize it to suit your personal preferences and trading goals. You can also learn more about Tradingview in our complete tutorial.
What is a stock heat map?
A stock heat map is a data visualization tool that shows the performance of stocks in real-time using color-coded cells. Each cell represents a stock and its color indicates the percentage change of its price over a selected timeframe. The cell size represents the market capitalization or the volume of the stock.
Which heatmap is best for trading?
The best heatmap for trading depends on your trading style, objectives, and preferences. However, some general criteria that you can use to evaluate a heatmap are:
The accuracy and reliability of the data
The variety and flexibility of the options and features
The ease of use and accessibility of the interface
The compatibility and integration with other trading tools and platforms
Based on these criteria, TradingView Heatmap is one of the best heatmaps for trading, as it offers:
Real-time and historical data from reliable sources
A wide range of options and features to customize and optimize your heatmap experience
A user-friendly and intuitive interface that works on any device
A seamless integration with other trading tools and indicators on TradingView
How do you read a stock heatmap?
To read a stock heatmap, you need to understand how to interpret the colors and the cell sizes of the heatmap. The colors indicate the percentage change of the price of each stock over a selected timeframe. The cell sizes represent the market capitalization or the volume of each stock. The brighter or darker the color, the higher or lower the percentage change. The larger or smaller the cell size, the bigger or smaller the market cap or volume.
Two of the most popular and comprehensive platforms for traders are TradingView and Investing.com.
In this article, we will compare and contrast TradingView and Investing.com across various criteria, such as user interface, charting tools, market coverage, pricing, and more.
TradingView and Investing.com are both online platforms that provide traders with various tools and resources for trading and investing.
They both have some core features and functionalities that make them popular and comprehensive platforms for traders. However, they also have some differences that make them unique and distinct from each other.
TradingView
TradingView is an online platform that was founded in 2011 by a group of traders and software developers. It is mainly focused on providing traders with interactive charts, advanced technical analysis tools, and social trading features.
TradingView has over 30 million monthly active users who use its platform to access real-time data from multiple sources, create custom indicators and strategies using pine script editor, backtest and optimize their trading systems using strategy tester, publish and share their trading ideas with other users, follow and copy other successful traders, and more.
TradingView Strengths
TradingView’s main strengths are its simplicity, elegance, and efficiency. It has a user-friendly interface that allows traders to easily navigate and customize their charts and tools. It also has a large and active community of traders who share their insights and feedback on various markets and instruments.
TradingView Weaknesses
TradingView’s main weaknesses are its limited data coverage and market insights. It does not cover some markets, such as options and futures, and it does not provide much news or fundamental analysis features.
Investing.com
Investing.com is an online platform that was founded in 2007 by a group of economists and entrepreneurs. It is mainly focused on providing traders with comprehensive data coverage, market insights, and portfolio management tools.
Investing.com has over 50 million monthly active users who use its platform to access real-time data from over 250 exchanges, historical data up to 20 years, global market coverage across 100+ countries, live news and analysis from various sources, and more.
Investing.com Strengths
Investing.com’s main strengths are its economic data and economic news. It has a user interface that allows traders to access a wide range of data and information from different markets and instruments.
Investing.com Weaknesses
Investing.com’s main weaknesses are its appearance and performance. It has a user interface that can be overwhelming and confusing for some users, especially beginners. It also has some issues with speed and reliability, especially on mobile devices.
Minimal indicators, but the charts work fine and are real-time
Extensive market research and recent market news is great
Plans start at $12.49 per month
Charting and Technical Analysis Tools
TradingView and Investing.com have different charting and technical analysis tools that provide traders with different options and capabilities for charting and analysis. They both have some pros and cons that can make them more or less suitable for certain trading needs and preferences.
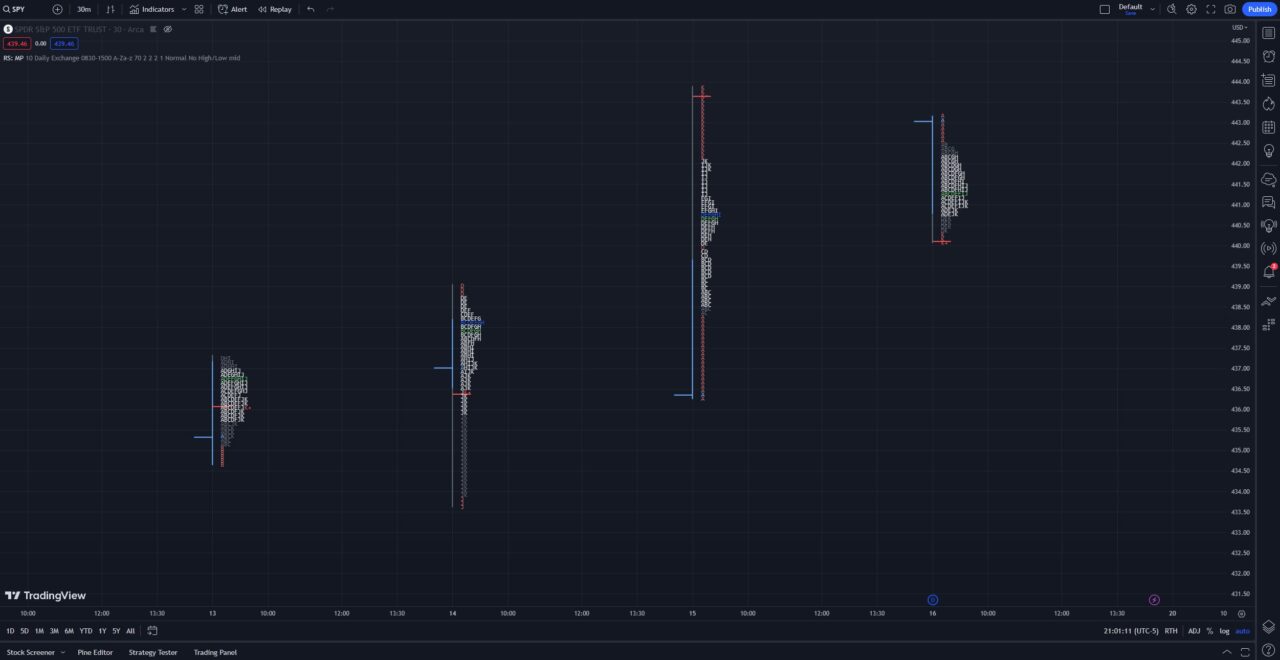
TradingView’s Charting and Technical Analysis Tools
TradingView Chart With Market Profile
TradingView’s charting and technical analysis tools have the following features:
Interactive charts: TradingView allows users to create and manipulate interactive charts for their markets and instruments. Users can choose from various chart types such as line, candlestick, bar, area, etc. Users can also adjust the time frames from tick charts to 1 month.
Advanced indicators: TradingView allows users to apply and modify over 100 built-in technical indicators to their charts. Users can choose from indicators such as moving averages, oscillators, volume profile, Fibonacci retracements, etc. TradingView also offers several paid indicators.
Pine Script editor: TradingView allows users to create and edit their own custom indicators and strategies using the Pine Script editor. Pine Script is a programming language that is designed for trading purposes. Users can use pine script to code their own logic, formulas, conditions, and rules for their indicators and strategies.
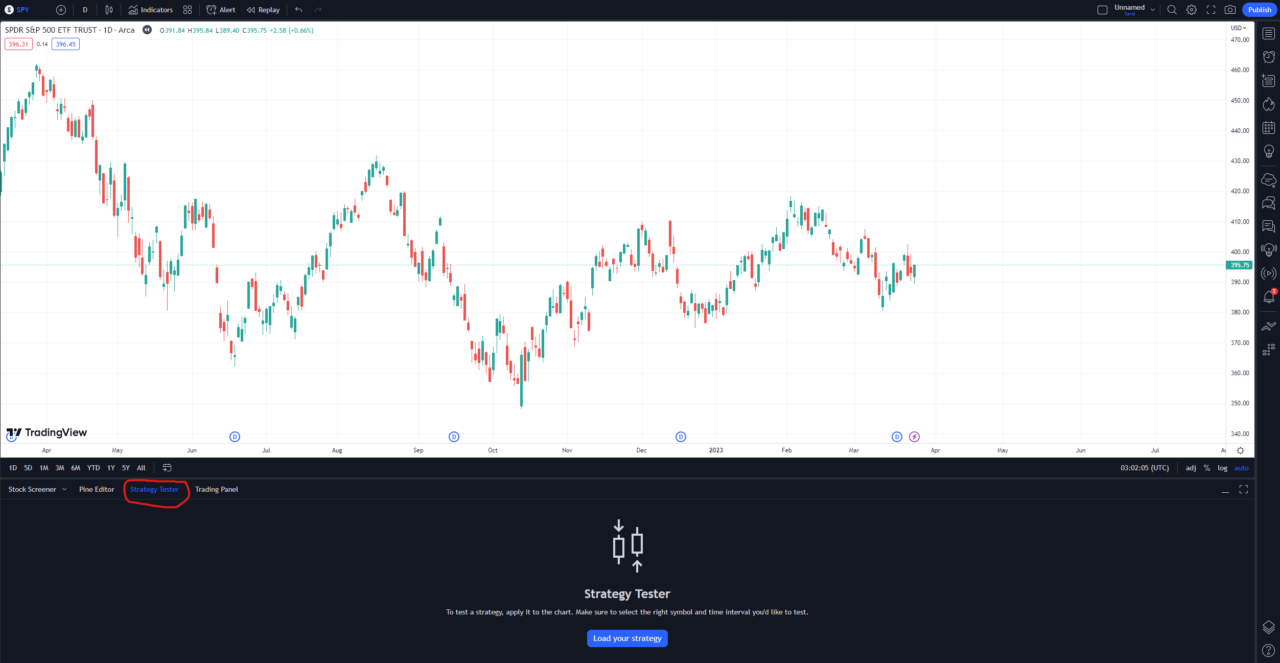
Backtesting: TradingView allows users to backtest their custom indicators and strategies using historical data. Users can use TradingView’s backtesting tools to evaluate the performance and profitability of their indicators and strategies over time.
Strategy tester: TradingView allows users to test their custom indicators and strategies using real-time data. Users can use strategy tester to simulate the execution and outcome of their indicators and strategies in live market conditions. Users can also monitor the results and statistics of their indicators and strategies.
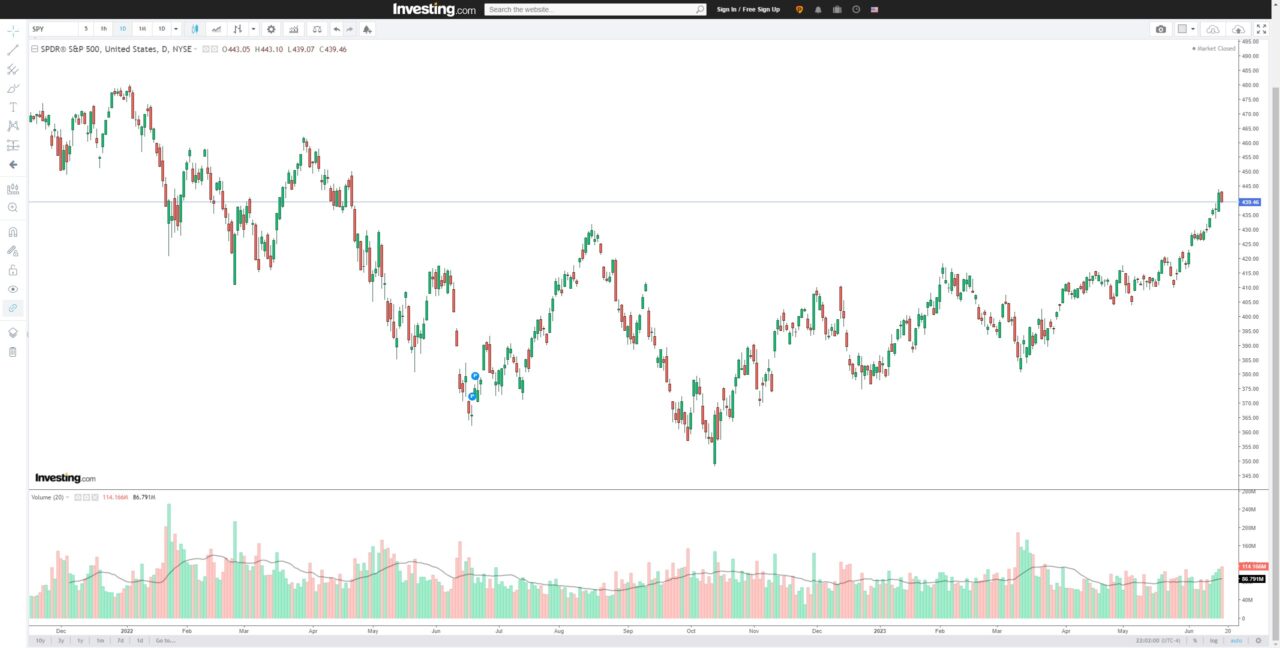
Investing.com’s Charting and Technical Analysis Tools
Investing.com Chart
Investing.com’s charting and technical analysis tools have the following features:
Live charts: Investing.com allows users to access live charts for their markets and instruments. Users can choose from various chart types such as line, candlestick, bar, area, etc. Users can also adjust the time frames from 1 minute to 1 month. Users can also zoom in and out, pan, scroll, and crosshair their charts.
Basic indicators: Investing.com allows users to apply and modify over 30 built-in technical indicators to their charts. Users can choose from indicators such as moving averages, oscillators, trend lines, Bollinger bands, etc. Users can also customize the parameters, colors, styles, and scales of their indicators.
Technical summaries: Investing.com provides users with technical summaries for their markets and instruments. Technical summaries are concise overviews of the technical analysis of the markets and instruments based on various indicators and time frames. Technical summaries also provide users with buy/sell signals based on the technical analysis.
Pattern recognition: Investing.com provides users with pattern recognition tools for their markets and instruments. Pattern recognition tools are automated tools that identify and highlight various chart patterns such as triangles, wedges, flags, etc. Pattern recognition tools also provide users with potential price targets based on the chart patterns.
Data Coverage and Market Insights
TradingView’s Data Coverage and Market Insights
TradingView’s data coverage and market insights have the following features:
Real-time data from multiple sources: TradingView provides users with real-time data from multiple sources such as exchanges, brokers, data providers, etc. Users can access real-time data for various markets such as stocks, forex, crypto, commodities, indices, etc. Users can also choose the preferred data source for their markets and instruments.
Historical data up to 40 years: TradingView provides users with historical data up to 40 years for their markets and instruments. Users can access historical data for various time frames such as daily, weekly, monthly, etc. Users can also use historical data for backtesting and analysis purposes.
Global market coverage across 135+ exchanges: TradingView provides users with global market coverage across 135+ exchanges in over 65 countries. Users can access data and information from various markets such as US, UK, Japan, China, India, etc. Users can also compare and contrast different markets and instruments across different regions and countries.
Unique features and indicators: TradingView provides users with unique features and indicators that enhance their data coverage and market insights. Some of these features and indicators are:
Economic calendar: TradingView provides users with an economic calendar that shows the upcoming economic events and indicators that can affect the financial markets. Users can filter the economic calendar by country, category, importance, etc. Users can also see the expected, actual, and previous values of the economic indicators.
Earnings calendar: TradingView provides users with an earnings calendar that shows the upcoming earnings reports of various companies. Users can filter the earnings calendar by market, sector, industry, etc. Users can also see the expected, actual, and previous values of the earnings per share (EPS) and revenue.
Seasonality: TradingView provides users with a seasonality tool that shows the historical performance of various markets and instruments over different periods of time. Users can use the seasonality tool to identify patterns, trends, cycles, and anomalies in the markets and instruments.
Crypto screener: TradingView provides users with a crypto screener that allows them to scan and filter various cryptocurrencies based on various criteria such as price, volume, market cap, change, etc. Users can also sort and rank the cryptocurrencies based on various metrics such as performance, volatility, liquidity, etc.
Investing.com’s Data Coverage and Market Insights
Investing.com’s data coverage and market insights have the following features:
Real-time data from over 250 exchanges: Investing.com provides users with real-time data from over 250 exchanges around the world. Users can access real-time data for various markets such as stocks, forex, crypto, commodities, indices, futures, options, etc. Users can also see the bid/ask prices, spreads, volumes, etc. of their markets and instruments.
Historical data up to 20 years: Investing.com provides users with historical data up to 20 years for their markets and instruments. Users can access historical data for various time frames such as daily, weekly, monthly, etc. Users can also use historical data for analysis and comparison purposes.
Global market coverage across 100+ countries: Investing.com provides users with global market coverage across 100+ countries in over 30 languages. Users can access data and information from various markets such as US, UK, Japan, China, India, etc. Users can also switch between different languages and currencies according to their preferences.
Additional market insights or news features: Investing.com provides users with additional market insights or news features that enhance their data coverage and market insights. Some of these features are:
Live news and analysis: Investing.com provides users with live news and analysis from various sources such as Reuters, Bloomberg, CNBC, etc. Users can access live news and analysis for various markets and instruments. Users can also filter the news and analysis by category, importance, source, etc.
Sentiment indicators: Investing.com provides users with sentiment indicators that show the mood and opinion of the trading community on various markets and instruments. Users can access sentiment indicators such as bullish/bearish percentage, buy/sell signals, investing.com technical summary, etc.
Portfolio tools and alerts: Investing.com provides users with portfolio tools and alerts that allow them to manage their portfolio performance and get alerts on market movements and opportunities. Users can create and track multiple portfolios for their markets and instruments.
TradingView vs. Investing.com Pricing
TradingView and Investing.com have different pricing and subscription plans that provide traders with different options and capabilities for accessing their features and functionalities. They both have some pros and cons that can make them more or less suitable for certain trading needs and preferences.
TradingView’s Pricing and Subscription Plans
TradingView’s pricing and subscription plans have the following features:
Free plan: TradingView offers a free plan that allows users to access some of its features and functionalities for free. Users can use the free plan to access interactive charts, basic indicators, data coverage, market insights, social trading features, etc. However, the free plan has some limitations, such as ads, fewer indicators, fewer alerts, fewer data sources, etc.
Free Trial: New users can usually try out any of TradingView’s premium plans for free when they use our affiliate link.
Paid plans: TradingView offers paid plans that allow users to access more of its features and functionalities for a monthly or annual fee. Users can choose from the following paid plans:
Essential plan: The Essential plan costs $14.95 per month or $155.40 per year. Users can use the Essential plan to access an ad-free experience, more indicators, multiple charts, more alerts, more data sources, etc.
Plus plan: The plus plan costs $29.95 per month or $299.40 per year. Users can use the plus plan to access all the features of the Essential plan plus more layouts, more devices, intraday renko charts, custom intervals, etc.
Premium plan: The Premium plan costs $59.95 per month or $599.40 per year. Users can use the premium plan to access all the features of the Plus plan plus more indicators per chart, more alerts per chart, priority customer support, etc.
Discounts: TradingView offers discounts for users who choose to pay annually instead of monthly. Users can save up to 16% by paying annually instead of monthly.
Investing.com’s Pricing and Subscription Plans
Investing.com’s pricing and subscription plans have the following features:
Free plan: Investing.com offers a free plan that allows users to access most of its features and functionalities for free. Users can use the free plan to access data coverage, market insights, charting tools, portfolio tools, alerts, social trading features, etc. However, the free plan has some limitations, such as ads, fewer portfolio tools, fewer analysis tools, fewer data sources, etc.
Paid plans: Investing.com offers Investing Pro plans that allow users to access more of its features and functionalities for a monthly or annual fee. Users can choose from the following paid plans:
Investing Pro: The Investing Pro plan costs $34.99 per month or $299.99 per year, or $479 for two years. Users can use the premium plan to access ad-free experience, advanced portfolio tools, premium analysis tools, premium data access, etc.
Discounts: Investing.com offers discounts for users who choose to pay annually instead of monthly. Users can save up to 42% by paying annually instead of monthly.
TradingView vs. Investing.com | Bottom Line
TradingView and Investing.com are both online platforms that provide traders with various tools and resources for trading and investing. They both have some core features and functionalities that make them popular and comprehensive platforms for traders. However, they also have some differences that make them unique and distinct from each other.
TradingView is mainly focused on providing traders with interactive charts, advanced technical analysis tools, and social trading features. However, TradingView lacks in market news and anything other than technical analysis. You can learn more in our complete TradingView tutorial.
Investing.com is mainly focused on providing traders with comprehensive data coverage, market insights, and portfolio management tools. Investing.com’s charting is good and includes several indicators, but TradingView’s interactive charts are much better for technical analysis.
Before you go
If you want to keep educating yourself about trading, you must check out these posts as well:
Are you looking for a reliable indicator that can help you identify price trends, volatility levels, and potential trading opportunities? If so, you might want to check out the Keltner Channel on TradingView.
The Keltner Channel is a banded indicator that shows you the range of price movement around a moving average. It can help you spot overbought and oversold conditions, breakouts, trend reversals, and more.
In this guide, you’ll learn everything you need to know about the Keltner Channel on TradingView, including:
What is the Keltner Channel and why should you use it?
How to set up the Keltner Channel on TradingView
How to trade with the Keltner Channel on TradingView
How to combine the Keltner Channel with other indicators or chart patterns
By the end of this guide, you’ll be able to use the Keltner Channel on TradingView to improve your trading performance and make better trading decisions.
What is the Keltner Channel, and Why Should You Use It?
The Keltner Channel was created by Chester Keltner, a commodity trader and financial analyst, in his 1960 book How to Make Money in Commodities. Since then, it has been modified and improved by various traders and analysts, most notably Linda Bradford Raschke.
The Keltner Channel consists of three lines:
The Upper Envelope, which is a moving average plus a multiple of the average true range (ATR)
The Middle Line, which is a moving average of price (usually an exponential moving average)
The Lower Envelope, which is a moving average minus a multiple of the ATR
The ATR is a measure of price volatility that takes into account the high, low, and close of each candlestick. The multiple of the ATR determines the width of the envelopes. The higher the multiple, the wider the envelopes.
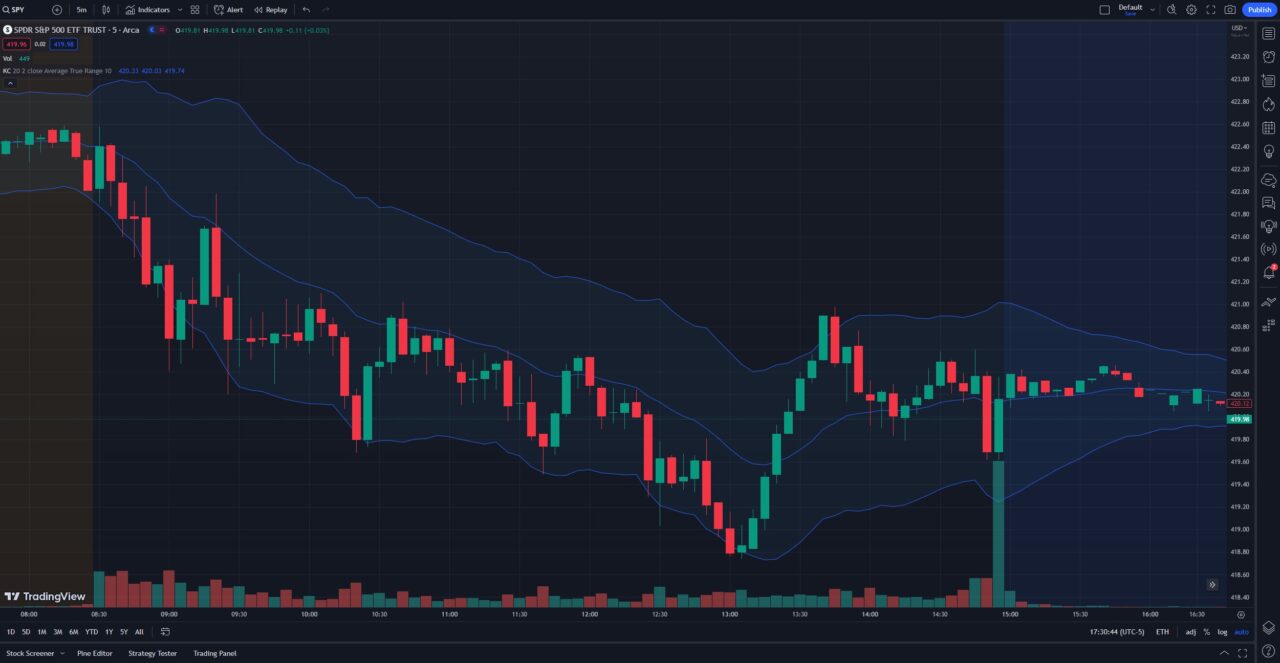
Here’s how the Keltner Channel looks like on TradingView:
The Keltner Channel has several advantages over other banded indicators, such as Bollinger Bands or Moving Average Envelopes. Some of these advantages are:
The Keltner Channel is less prone to false signals or whipsaws, as it uses the ATR instead of the standard deviation to measure volatility. The ATR is more stable and consistent than the standard deviation, which can fluctuate wildly depending on the price action.
The Keltner Channel can adapt to different market conditions, as it expands and contracts with the ATR. This means that the envelopes can adjust to the changing volatility and price range of the market, giving you more accurate signals.
The Keltner Channel can help you identify price trends, as it shows you the direction and strength of the moving average. When the price is above the middle line, it indicates an uptrend. When the price is below the middle line, it indicates a downtrend. The steeper the slope of the middle line, the stronger the trend.
How to Set Up the Keltner Channel on TradingView
Setting up the Keltner Channel on TradingView is easy and straightforward. Here are the steps you need to follow:
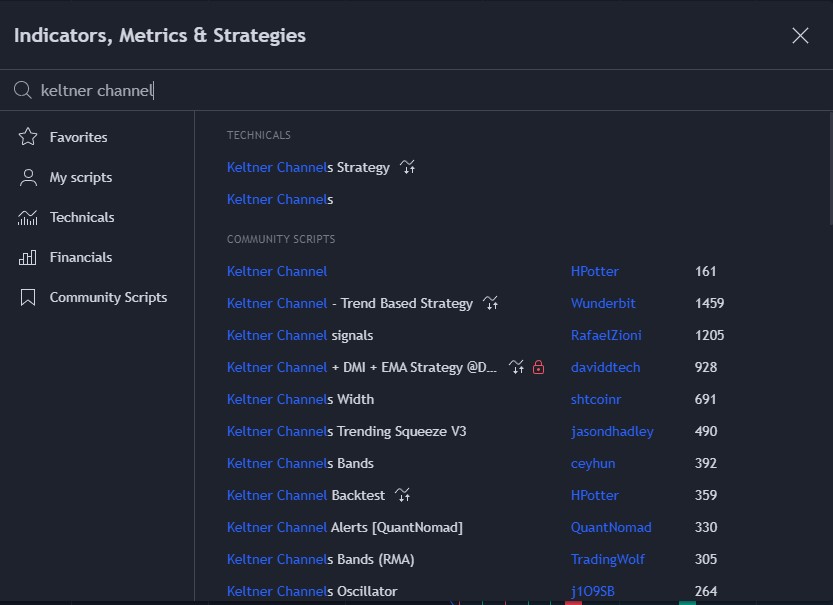
Open any chart on TradingView and click on the Indicators button at the top of the screen.
Type “Keltner Channel” in the search box and select the indicator from the list.
The Keltner Channel will appear on your chart with the default settings. You can customize these settings by clicking on the Settings icon next to the indicator name.
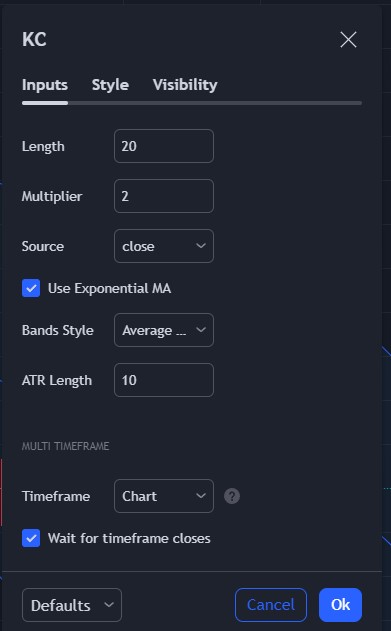
In the settings window, you can change various parameters of the Keltner Channel, such as:
Indicator Timeframe: Specifies the timeframe that the indicator is calculated on. This option allows calculating KC based on data from another timeframe, e.g., having KC calculated on 1H chart be displayed on a 5m chart.
Length: The time period to be used in calculating the MA which creates the base for the Upper and Lower Envelopes (20 is the default).
Multiplier: The multiplier to be applied to the bands.
Source: Determines what data from each bar will be used in calculations. Close is the default.
Use Exponential MA: Determines if a simple or exponential moving average will be used for the basis.
Bands Style: Determines if high/low range or average true range will be used for the bands.
ATR Length: The time period to be used in calculating the Average True Range.
Style: Allows you to change the color, thickness, and style of the Upper, Middle, and Lower lines. You can also toggle the visibility of a background color within the bands.
Once you’re happy with your settings, click on OK to apply them to your chart.
How to Trade with the Keltner Channel on TradingView
Now that you have the Keltner Channel on your chart, how do you use it to trade? There are several ways to trade with the Keltner Channel, depending on your trading style and objectives. Here are some of the most common and effective strategies:
Breakout Trading
One of the simplest and most popular ways to trade with the Keltner Channel is to look for breakouts above or below the envelopes. A breakout occurs when the price closes outside of the envelopes, indicating a strong price movement in that direction.
A breakout above the upper envelope signals a bullish breakout, meaning that the price is likely to continue rising. A breakout below the lower envelope signals a bearish breakout, meaning that the price is likely to continue falling.
To trade breakouts with the Keltner Channel, you can use the following rules:
Wait for a candlestick to close above or below the envelopes.
Enter a long position if the breakout is above the upper envelope, or a short position if the breakout is below the lower envelope.
Place a stop-loss order below or above the opposite envelope, or use a trailing stop to lock in profits as the price moves in your favor.
Exit your position when the price reaches your target, or when it reverses and closes back inside the envelopes.
Trend Following
Another way to trade with the Keltner Channel is to use it as a trend following indicator. This means that you trade in the direction of the prevailing trend, as indicated by the position and slope of the middle line.
When the price is above the middle line and the middle line is sloping upward, it indicates an uptrend. When the price is below the middle line and the middle line is sloping downward, it indicates a downtrend.
To trade trend following with the Keltner Channel, you can use the following rules:
Identify the direction and strength of the trend by looking at the position and slope of the middle line.
Enter a long position if the price is above the middle line and the middle line is sloping upward, or a short position if the price is below the middle line and the middle line is sloping downward.
Place a stop-loss order below or above the opposite envelope, or use a trailing stop to lock in profits as the price moves in your favor.
Exit your position when the trend changes, or when it reaches your target.
Mean Reversion
A third way to trade with the Keltner Channel is to use it as a mean reversion indicator. This means that you trade against the prevailing trend, expecting that the price will revert to the mean, which is the middle line.
When the price is above the upper envelope, it indicates that the price is overbought and likely to fall. When the price is below the lower envelope, it indicates that the price is oversold and likely to rise.
To trade mean reversion with the Keltner Channel, you can use the following rules:
Wait for the price to reach or cross the upper or lower envelope.
Enter a short position if the price is above the upper envelope, or a long position if the price is below the lower envelope.
Place a stop-loss order above or below the opposite envelope, or use a trailing stop to lock in profits as the price moves in your favor.
Exit your position when the price reaches or crosses the middle line, or when it reaches your target.
How to Combine the Keltner Channel with Other Indicators or Chart Patterns
The Keltner Channel can be a powerful indicator on its own, but it can also be combined with other indicators or chart patterns to confirm or enhance your signals. Here are some of the most common and effective combinations:
Moving Averages: You can use moving averages to filter out noise and identify the long-term trend. For example, you can use a 50-period simple moving average (SMA) to determine the trend direction, and only trade in that direction with the Keltner Channel. Alternatively, you can use a faster moving average, such as a 10-period exponential moving average (EMA), to act as a dynamic support or resistance level, and trade with the Keltner Channel when the price bounces off or breaks through the EMA.
Oscillators: You can use oscillators, such as the Relative Strength Index (RSI) or the Stochastic Oscillator, to measure the momentum and strength of the price movement. For example, you can use the RSI to confirm overbought and oversold conditions with the Keltner Channel, and look for divergences or convergences between the price and the RSI. Alternatively, you can use the Stochastic Oscillator to identify potential trend reversals with the Keltner Channel, and look for bullish or bearish crossovers between the %K and %D lines.
Candlestick Patterns: You can use candlestick patterns, such as doji, hammer, engulfing, or shooting star, to indicate the sentiment and psychology of the market participants. For example, you can use a doji candlestick to signal indecision or uncertainty with the Keltner Channel, and look for a confirmation candlestick in the next period. Alternatively, you can use a hammer or shooting star candlestick to signal a possible reversal with the Keltner Channel, and look for a confirmation candlestick in the opposite direction.
The Keltner Channel is a versatile and effective indicator that can help you identify price trends, volatility levels, and potential trading opportunities on TradingView. You can use it to trade breakouts, trend following, mean reversion, or any combination of these strategies. You can also combine it with other indicators or chart patterns to confirm or enhance your signals.
The Keltner Channel is easy to set up and customize on TradingView, and you can experiment with different settings and strategies to find what works best for you. If you want to learn more about the Keltner Channel or other TradingView indicators, check out our other articles on VWAP TradingView, Best TradingView Indicators, and TradingView Moving Average.
TradingView is one of the most popular platforms for traders and investors who want to analyze and trade the financial markets. It offers a variety of tools and features that make it easy to create and customize charts, indicators, strategies, and more.
One of the tools that you can use on TradingView charts is the rectangle tool. Rectangles are useful for highlighting areas of interest, support and resistance levels, price ranges, breakouts, and patterns on the chart. They can also help you visualize your trading plan and manage your risk and reward.
In this article, I will show you how to draw a rectangle on TradingView in five simple steps.
Step 1: Open any chart on TradingView
The first step to draw a rectangle on TradingView is to open any chart that you want to analyze. You can use the search box at the top left corner of the screen to find the symbol that you are interested in.
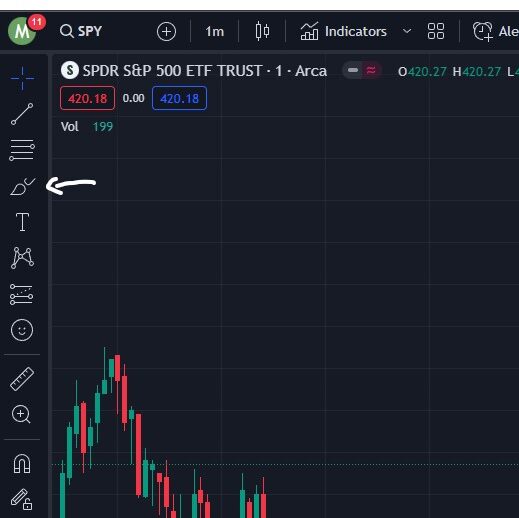
Step 2: Locate the drawing tool panel on the left
The next step is to locate the drawing tool panel on the left side of the screen. This is where you can find all the different drawing tools that you can use on your chart.
To access the drawing tool panel, you can click on the brush icon on the left side of the screen. You will see a list of different drawing tools that you can choose from.
To find the rectangle tool, you can scroll down the list and look for it. To select the rectangle tool, you can simply click on it.
Step 3: Draw a rectangle on the chart
The third step is to draw a rectangle on the chart using the rectangle tool.
The way to do this is to simply click on the chart twice. This means that you click on the chart where you want to start the rectangle, then move your cursor to where you want to end the rectangle and click again. The rectangle will be drawn between the two points.
You can adjust the size and position of the rectangle by moving the dots at the corner of the rectangle. You can also move the entire rectangle by clicking and dragging the middle dot.
The fourth step is to customize the appearance of the rectangle according to your preference. You can change various aspects of the rectangle, such as its color, opacity, border style, text, and more.
To customize the appearance of the rectangle, you need to right-click on the rectangle and select “Settings” from the menu. You will see a dialog box where you can adjust the properties of the rectangle.
Here are some of the things that you can change in the settings dialog:
Border: You can change the color of the border as well as its thickness and style. You can also choose to hide the border completely.
Background: You can toggle the visibility, color, and opacity level of the rectangle background. You can also choose to fill the background with a gradient or a pattern.
Text: You can add text to the rectangle and choose its position, font, size, color, and alignment. You can also add a background color and a border to the text.
Coordinates: You can change the coordinates of the rectangle by entering the values for the top left and bottom right corners. You can also lock the coordinates to prevent accidental changes.
Visibility: You can choose which timeframes and symbols to show or hide the rectangle on. You can also choose to show or hide it on all charts.
Step 5: Delete or modify the rectangle
The fifth and final step is to delete or modify the rectangle if you want to. There are several ways to do this:
To delete the rectangle, you can right-click on the border of the rectangle and select “Remove drawing” from the menu. You can also press the delete key on your keyboard while selecting the rectangle. Another way is to click on the edge of the rectangle and click on the trash can icon that appears.
To modify the rectangle, you can right-click on the border of the rectangle and select “Edit” from the menu. You can also double-click on the border of the rectangle to open the settings dialog. From there, you can change any of the properties of the rectangle as explained in step 4.
Conclusion: How to Draw a Rectangle on TradingView
In this article, you have learned how to draw a rectangle on TradingView in five simple steps. You have also learned how to customize, delete, or modify the rectangle according to your preference.
Rectangles are useful tools for highlighting areas of interest, support and resistance levels, price ranges, breakouts, and patterns on the chart. They can also help you visualize your trading plan and manage your risk and reward.
Candlestick patterns are powerful tools for traders and investors looking to analyze price movements and make informed trading decisions. However, there are times when you may find that candlesticks have disappeared from your TradingView chart.
In this article, we’ll explore what candlestick patterns are, how to get them on TradingView, and how to unhide them if they’ve accidentally been hidden. Let’s dive in!
What to Do If Candlesticks Disappear from Your Chart
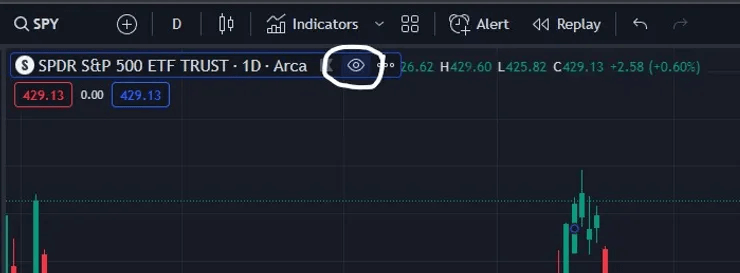
If you find that candlesticks are missing from your TradingView chart, don’t worry! The most likely reason is that you’ve accidentally hidden the data series, making the candlesticks invisible.
To unhide the candlesticks and make them visible again, simply click on the little eye icon next to the symbol’s name on your chart. This will restore the visibility of the candlesticks and allow you to continue analyzing price movements.
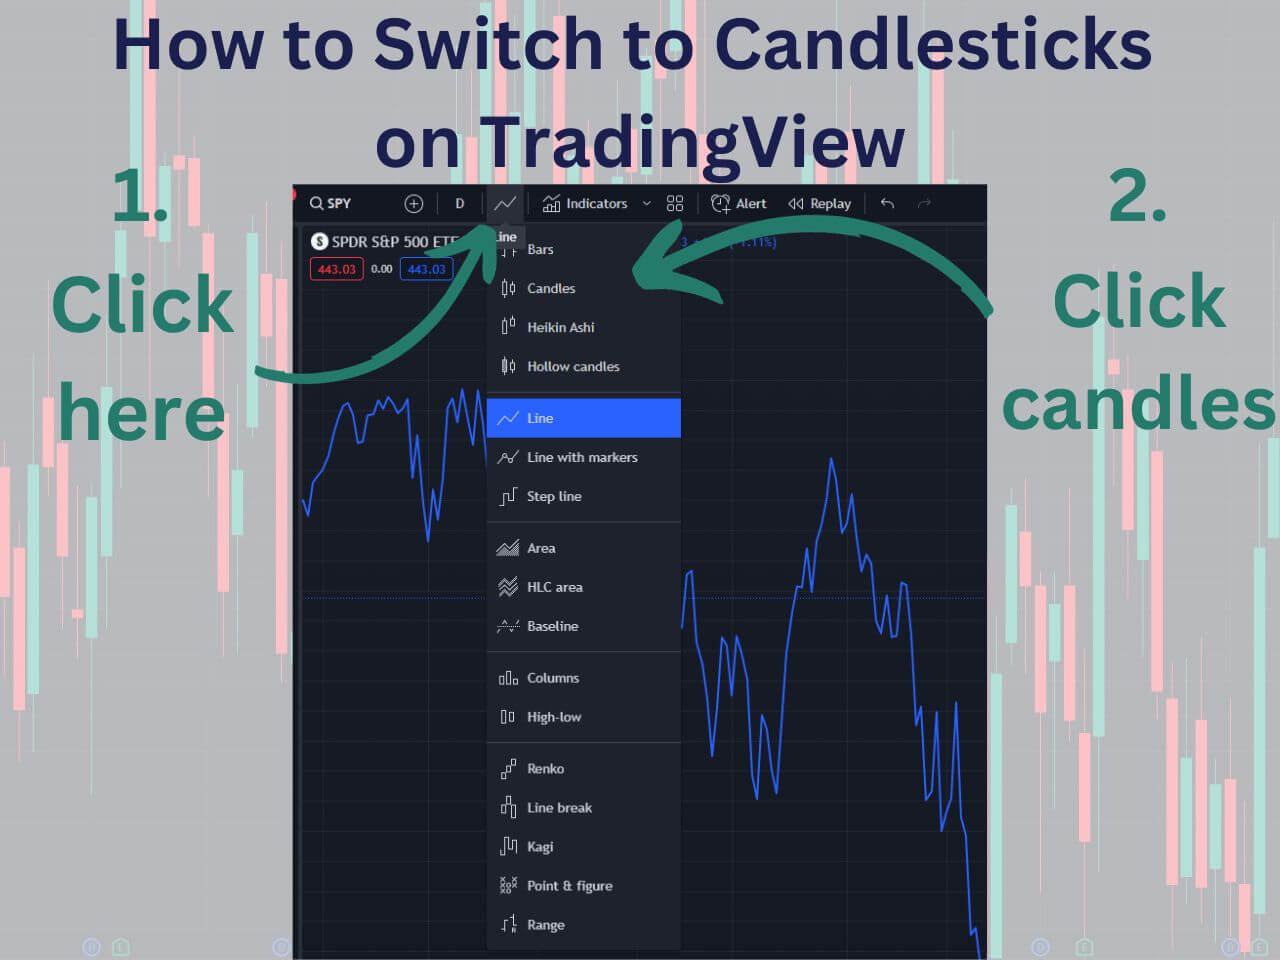
How to Switch to Candlestick Charts on TradingView
Click the icon on the right side of the timeframe button at the top left
Click candles from the dropdown menu
If your current chart is a line or something other than candlesticks, you can click the icon on the right side of the timeframe button on the top left of the chart.
From here, a dropdown menu will appear, and you can click candles.
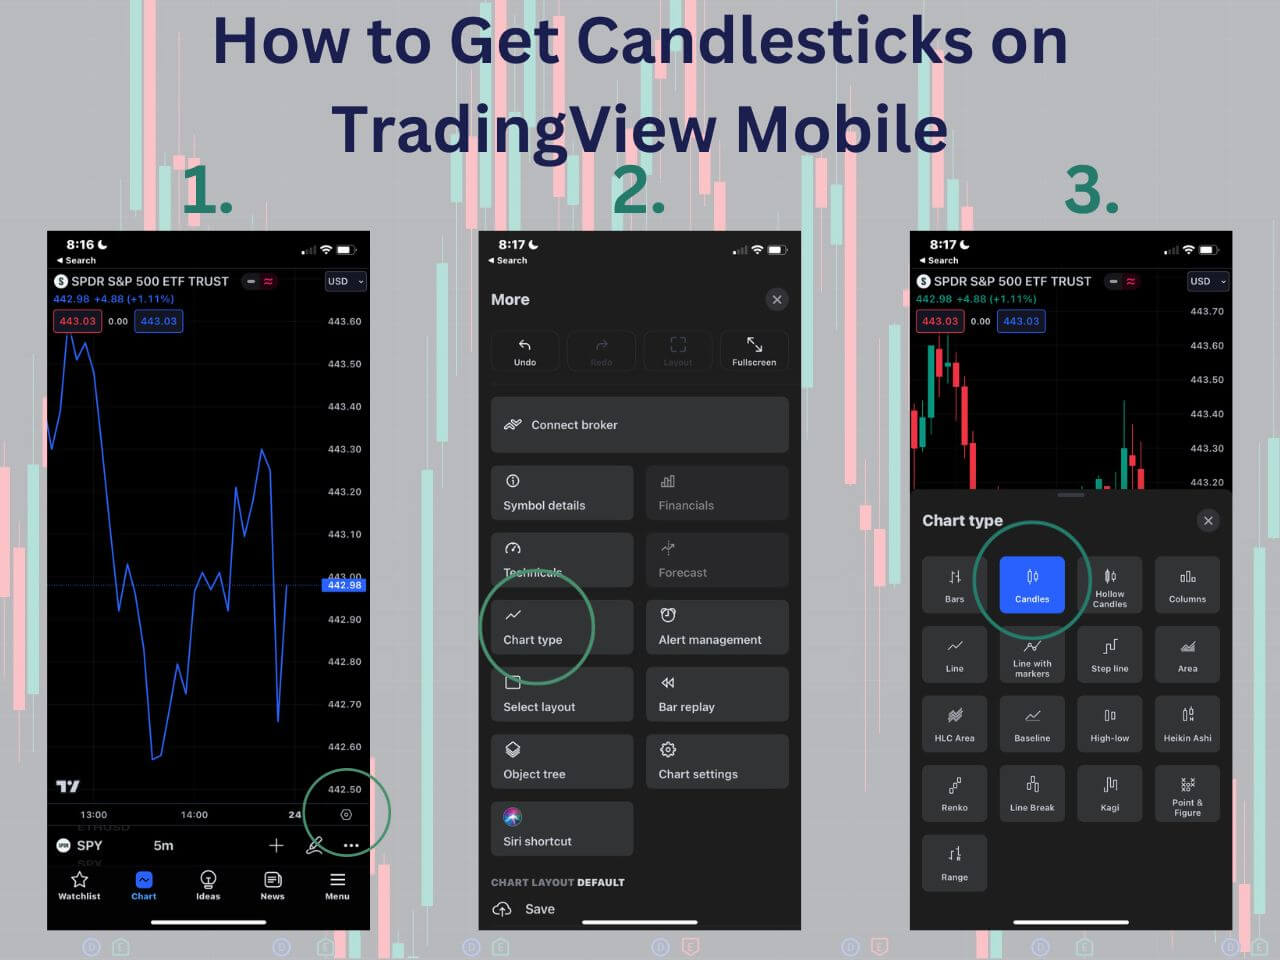
How to Change to Candlesticks on TradingView Mobile App
Tap the gear icon at the bottom right corner of the chart tab
Tap chart type
Tap candles
What Are Candlestick Patterns?
Candlestick patterns are visual representations of price movements over specific time periods. Each candlestick shows the opening price, closing price, highest price, and lowest price during that period. Originating in Japan centuries ago, candlestick charts have become a popular tool for traders around the world. Candlestick patterns can be classified into two main categories:
Bullish Patterns: Indicate that the price of a security is likely to go up.
Bearish Patterns: Indicate that the price of a security is likely to go down.
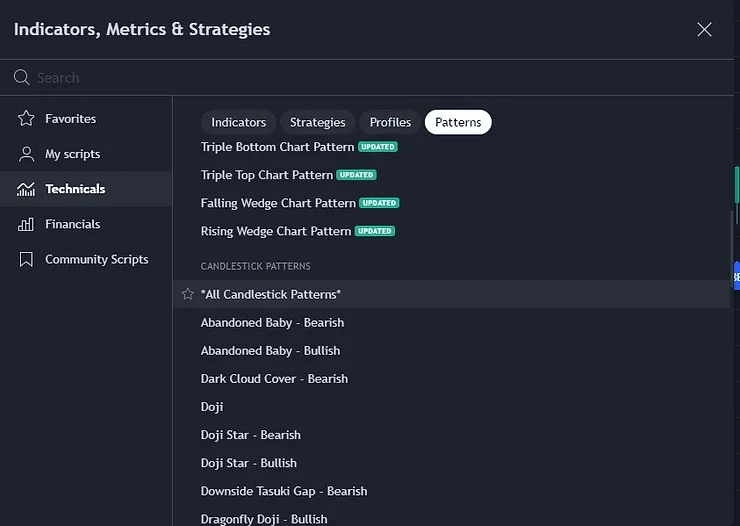
How to Get Candlestick Patterns on TradingView
To access candlestick pattern indicators on TradingView, follow these steps:
Open the Indicators and Strategies menu on TradingView.
Navigate to the Patterns tab under technicals.
Select the candlestick pattern indicators you wish to use from the list.
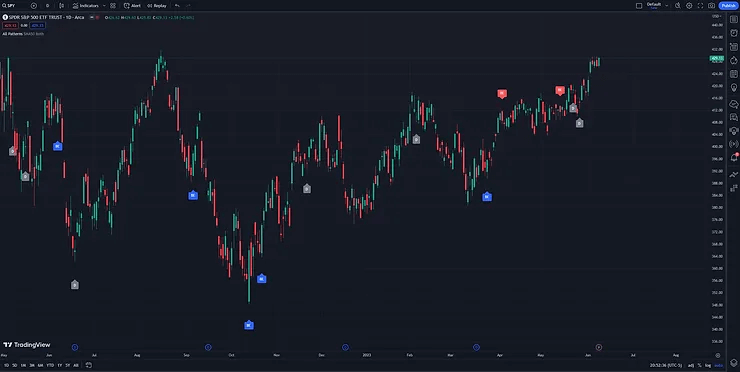
Once you’ve added the indicators, TradingView will label the patterns on the chart:
Tips for Using Candlestick Patterns in Technical Analysis
Use candlestick patterns in conjunction with other technical indicators for comprehensive analysis.
Practice analyzing patterns on historical data to build confidence.
Remember that candlestick patterns are not a guarantee of future price movements.
Frequently Asked Questions About Candlesticks on TradingView
Why can’t I see candles in TradingView?
If you’re unable to see candlesticks on your chart, it’s possible that you’ve accidentally hidden the data series. To unhide the candlesticks, simply click on the little eye icon next to the symbol’s name on your chart. This will restore the visibility of the candlesticks, allowing you to continue your analysis.
How do you read candles on TradingView?
Reading candlesticks involves understanding the four key price points: the opening price, closing price, highest price, and lowest price. The body of the candle represents the range between the opening and closing prices, while the wicks show the highest and lowest prices.
How do I unhide candles on TradingView?
If you’ve accidentally hidden candles, you can unhide them by selecting the “Candles” chart type from the toolbar at the top of the chart.
What are all the candlestick patterns indicators in TradingView?
TradingView offers a variety of candlestick pattern indicators, including but not limited to:
To enable the remaining time for the current candle, right-click the price scale on the right-hand side of the chart, then click ‘countdown to bar close.’
How Much Is TradingView?
TradingView offers a range of pricing plans to suit traders at every level of ambition, along with usually offering a free trial option for new users. Here’s an overview of the available plans:
Free Plan
The Free Plan allows you to access the basic features of TradingView, and it costs $0 forever. No credit card is needed to sign up for this plan.
Pro Plan
The Pro Plan offers a distraction-free trading experience with more charts, intervals, and indicators. Key benefits include:
5 indicators per chart
2 charts in one layout
40 active server-side alerts
Ad-free experience
Volume profile indicators
Custom time intervals
Multiple watchlists
Bar Replay on intraday bars
Multi-monitor support in Desktop app
Pro+ Plan
The Pro+ Plan is designed for intraday technical analysis and day traders looking to take things to the next level. It includes all the advantages of the Pro Plan, plus:
10 indicators per chart
4 charts in one layout
200 active server-side alerts
10 saved chart layouts
Intraday exotic charts
Charts based on custom formulas
Chart data export
Indicators on indicators
Premium Plan
The Premium Plan is the complete package, offering the highest precision and maximum data to capture all possible opportunities. It includes:
25 indicators per chart
8 charts in one layout
800 active server-side alerts
Unlimited saved chart layouts
Second-based intervals
Alerts that don’t expire
4x more data on charts (20K bars)
Publishing invite-only indicators
4x more intraday data in Bar Replay
How to Get Candlesticks on TradingView | Bottom Line
Candlestick patterns offer invaluable insights into price movements and market trends. By accessing and utilizing these patterns on TradingView, traders can make informed decisions and refine their trading strategies.
Whether you’re an experienced trader or just starting, mastering candlestick patterns is a valuable skill for your trading toolkit. So, go ahead and explore the world of candlestick patterns on TradingView and discover the insights they have to offer. You can also get a free trial of TradingView using our affiliate link.
Before you go
If you want to keep educating yourself about personal finance, you must check out these posts as well: