TradingView vs. Investing.com: Which Platform is Better for You?
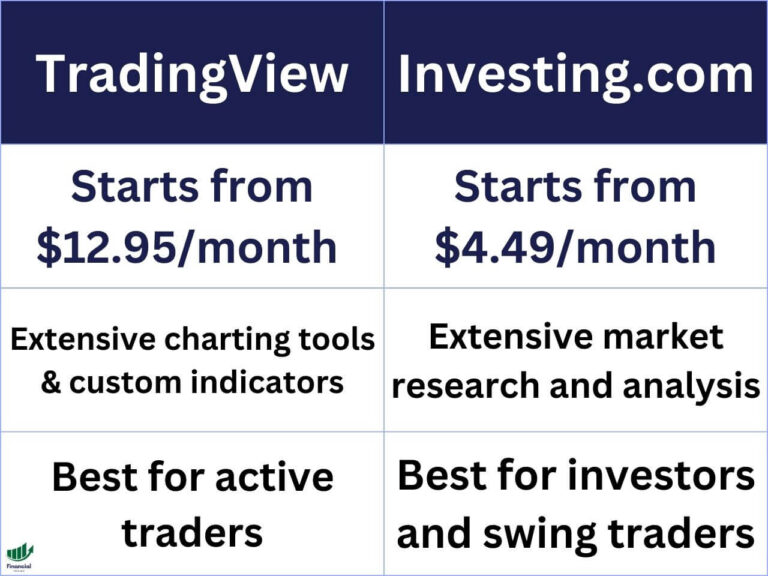
Two of the most popular and comprehensive platforms for traders are TradingView and Investing.com. In this article, we will compare and contrast TradingView and Investing.com across various criteria, such as user interface, charting tools, market coverage, pricing, and more. TradingView Starting at $14.95/month Extensive charting tools Custom indicators Ideal for active traders Start Free Trial…