TradingView vs. thinkorswim: A Detailed Comparison

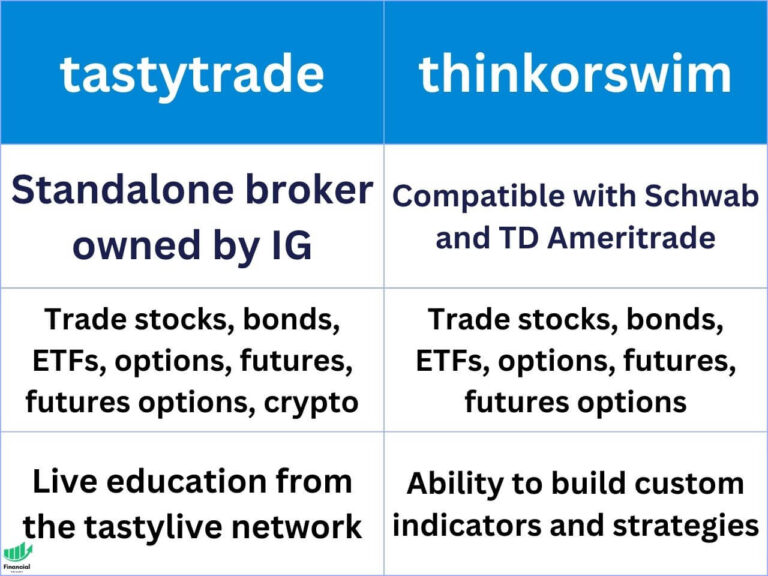
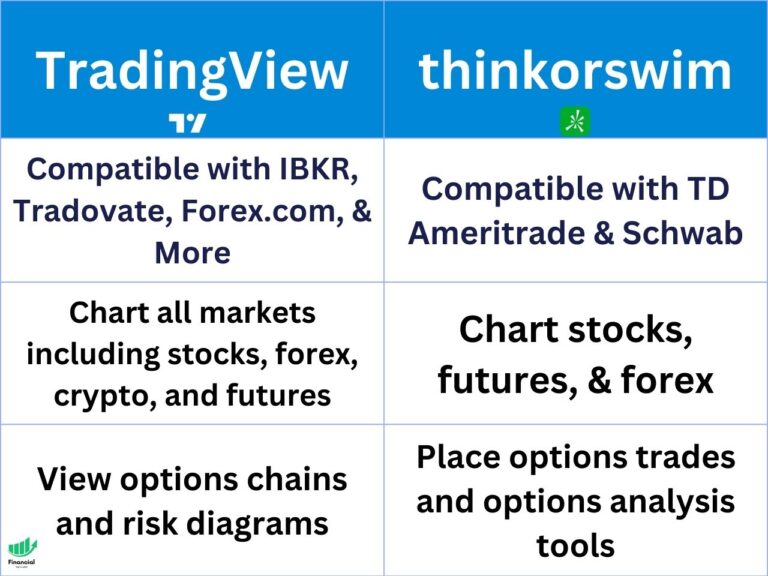
a table comparing tradingview and thinkorswim

If you are looking for a trading platform that can help you perform technical analysis and execute trades, you may have come across TradingView and thinkorswim. These are two of the top trading platforms for technical analysis, but they have different features, costs, and suitability for different types of traders.

In this article, we will compare TradingView and thinkorswim in detail and help you decide which one is better for you.

Key Takeaways

  • TradingView is a charting and trading platform that connects with brokers.
  • thinkorswim is a trading platform for Schwab or TD Ameritrade accounts.
  • While you can trade on TradingView, it is more commonly used for just charting and analysis.

I personally prefer to use a combination of TradingView for charting and either thinkorswim, Robinhood, or tastytrade to place my trades.

TradingView

  • Best Free Charting Tool
  • Integrates With Various Brokers
  • Supports Stocks, Futures, Crypto, Forex, & More
Start Free Trial

thinkorswim

  • Best for Options Trading
  • Only Works With Funded Schwab Accounts
  • Outdated Charting Features
Learn More

How TradingView and thinkorswim Differ

TradingView is a freemium service that provides you with charting, news, stock screeners, advanced indicators, and many more features. It also integrates with various brokers and offers trading for most asset classes, including cryptocurrencies. Many people use TradingView for charting, and place their trades on a separate brokerage account. TradingView is not a brokerage, but a software traders use for charting and other tools.

thinkorswim is also a charting platform, but it is owned by the brokerage Schwab, meaning you must have an funded Schwab or TD Ameritrade account to use the platform. thinkorswim is a free platform that only works with Schwab and TD Ameritrade and offers trading for stocks, options, bonds, futures, currencies, and Bitcoin futures.

Here are some of the advantages and disadvantages of each platform in terms of brokers and assets:

Platform Compatible Brokers Assets Offered Options Trading Pricing
TradingView Free Trial Various brokers, including Interactive Brokers, Tradovate, AMP Global, OANDA, Forex.com, and Gemini Stocks, bonds, commodity futures, currencies, and cryptocurrencies Analyze nearly live options chains and risk diagrams Freemium service with different plans ranging from $12.95 to $59.95 per month. You can also get a free trial.
thinkorswim Learn More Only TD Ameritrade & Schwab Stocks, bonds, commodity futures, currencies, and Bitcoin futures Supported with options chain data and P&L charts Free platform for TD Ameritrade & Schwab customers

TradingView

Pros

  • View free charts with nearly real-time data for stocks, futures, crypto, and forex
  • Supports trading for stocks, bonds, commodity futures, currencies, and cryptocurrencies
  • Integrates with a variety of brokers, such as Interactive Brokers, Tradovate, AMP Global, OANDA, Forex.com, and Gemini
  • Allows you to trade directly from the charts or use paper trading to practice without risking real money

Cons

  • The level of integration may vary depending on the broker and the asset class
  • Does not support options trading, but does provide options analysis tools
  • Requires a paid subscription to access advanced features and services

thinkorswim

Pros

  • Supports trading for stocks, options, bonds, commodity futures, currencies, and Bitcoin futures
  • Fully integrated with Schwab or TD Ameritrade’s brokerage services and account management
  • Supports options trading and includes options chain data and risk diagrams for multi-leg options strategies

Cons

  • Only works with Schwab (formerly TD Ameritrade) and requires a TD Ameritrade or Schwab account to use the platform
  • Does not support cryptocurrency trading or provide cryptocurrency price data
  • May have higher commissions and fees than some other brokers

Based on this comparison, TradingView may be the better choice for traders who want to trade a wider range of asset classes, especially cryptocurrencies, and have more flexibility in choosing their broker. Thinkorswim may be the better choice for traders who are already TD Ameritrade or Schwab customers or who want to trade options.

thinkorswim vs tradingview
thinkorswim

How TradingView and thinkorswim Compare in Terms of Technical Analysis

Technical analysis is the process of using charts, indicators, and patterns to analyze the price movements of an asset and predict its future direction. Both TradingView and thinkorswim offer comprehensive and customizable charting tools and indicators, but they have some differences in their technical analysis features.

TradingView excels in technical analysis and offers a wide range of charting tools and indicators. It is also more beginner-friendly and has a built-in trader community. Thinkorswim also provides robust charting capabilities and is known for its high-quality charts. It also supports options trading and includes options analysis tools.

Here are some of the similarities and differences between the two platforms in terms of technical analysis:

TradingView Technical Analysis

Pros

  • Offers over 100 chart types, including candlestick, line, bar, renko, heikin ashi, kagi, point & figure, and more
  • Provides over 50 drawing tools, such as trend lines, channels, Fibonacci retracements, pitchforks, Gann tools, and more
  • Includes over 100 pre-built indicators, such as moving averages, oscillators, volume indicators, volatility indicators, and more
  • Allows you to create your own custom indicators using Pine Script or import indicators from other users
  • Has a built-in trader community where you can share your ideas, follow other traders, and get feedback

Cons

  • Requires a paid subscription to access more advanced features, such as the volume profile indicator, multiple charts per layout, intraday data, extended trading hours, and more
  • Does not support options trading or provide options analysis tools
tradingview vs thinkorswim
TradingView

thinkorswim Technical Analysis

Pros

  • Offers over 20 chart types, including candlestick, line, bar, monkey bars, and more
  • Provides over 30 drawing tools, such as trend lines, channels, Fibonacci retracements, pitchforks, Gann tools, and more
  • Includes over 300 pre-built indicators, such as moving averages, oscillators, volume indicators, volatility indicators, and more
  • Allows you to create your own custom indicators using thinkScript or import indicators from other users

Cons

  • Has a steeper learning curve and may be overwhelming for beginners
  • Does not have a built-in trader community or a social media integration
  • May have some compatibility issues when using the desktop or mobile platform

Based on this comparison, TradingView may be the better option for traders who want to use a wider range of charting tools and indicators, or who want to interact with other traders and learn from their ideas. Thinkorswim may be the better option for traders who want to use options analysis tools.

How TradingView and thinkorswim Differ in Terms of User Interface and Design

User interface and design are important factors for trading platforms as they affect the user experience and satisfaction. A good user interface should be easy to navigate, intuitive to use, and visually appealing. A good design should be modern, responsive, and customizable.

TradingView has a more user-friendly and modern interface, while thinkorswim has a more vintage and customizable interface. Both platforms offer a web-based version as well as a desktop and mobile version.

Here are some of the pros and cons of each platform in terms of user interface and design:

TradingView UX

Pros

  • Has a simple and intuitive interface that is easy to use for beginners and experts alike
  • Has a modern and sleek design that is aesthetically pleasing and professional-looking
  • Has a web-based platform that can be accessed from any browser without downloading or installing anything

Cons

  • Has a limited customization options for the interface layout, colors, fonts, etc.
  • Has a desktop and mobile version that may not have all the features and functions of the web-based platform

thinkorswim UX

Pros

  • Has a high level of customization options for the interface layout
  • Has a desktop platform that is fast and reliable and offers more features and functions than the web-based platform

Cons

  • Has a complex and cluttered interface that may be confusing and overwhelming for beginners
  • Has a dated and bulky design that may not be appealing to some users
  • The desktop platform can get laggy at times, depending on your PC

Based on this comparison, TradingView may be the better choice for traders who want to use a simple and modern interface that is easy to use and access from any browser. Thinkorswim may be the better choice for traders who want to use a more customizable interface that offers more features and functions on the desktop platform.

How TradingView and thinkorswim Compare in Terms of Pricing and Plans

Pricing and plans are another important aspect to consider when choosing a trading platform, as they affect the access to features and services. TradingView is a free platform with optional pay-to-use service that offers different plans depending on the features and services needed, while thinkorswim is a free platform that comes with a TD Ameritrade or Schwab account.

Here are some of the details and differences between the two platforms in terms of pricing and plans:

TradingView

  • Offers four plans: Free, Essential, Plus, and Premium
  • The Basic plan is free and offers limited features, such as one chart per layout, one alert, three indicators per chart, etc.
  • The Essential plan costs $14.95 per month or $155.40 per year and offers more features, such as two charts per layout, 10 alerts, five indicators per chart, etc.
  • The Plus plan costs $29.95 per month or $299.40 per year and offers even more features, such as four charts per layout, 30 alerts, 10 indicators per chart, etc.
  • The Premium plan costs $59.95 per month or $599.40 per year and offers the most features, such as eight charts per layout, 200 alerts, 25 indicators per chart, etc.
  • All paid plans offer additional benefits, such as intraday data, extended trading hours, priority customer support, etc.
  • Usually offers a 30-day free trial for any paid plan

TradingView Limited Time Offer!

Exclusive Deal: 30-Day FREE Premium Access + Bonus Credit

Don’t Miss Out – Sign up for TradingView Now!

  • Advanced Charts
  • Real-Time Data
  • Track all Markets
CLAIM YOUR FREE TRIAL

thinkorswim

  • Is free to use and only requires a funded account
  • Comes with a TD Ameritrade or Schwab account, which may have commissions and fees for trading certain assets
  • Offers all the features and services without any limitation or restriction

Based on this comparison, TradingView may be the better option for traders who want to access more advanced and expansive features and services, and who don’t mind paying a monthly or yearly fee. Thinkorswim may be the better option for traders who want to use a free platform with comprehensive features and services, and who are already TD Ameritrade customers or don’t mind opening an account with them.

TradingView vs. thinkorswim: Which Trading Platform Is Better for You?

In conclusion, TradingView and thinkorswim are both excellent trading platforms for technical analysis, but they have different features, costs, and suitability for different types of traders. Here is a summary of the main differences and similarities between the two platforms:

  • TradingView is a freemium service that integrates with various brokers and offers trading for most asset classes, including cryptocurrencies. Thinkorswim is a free platform that only works with TD Ameritrade or Schwab and offers trading for stocks, bonds, futures, currencies, and Bitcoin futures.
  • TradingView excels in technical analysis and offers a wide range of charting tools and indicators. It is also more beginner-friendly and has a built-in trader community. Thinkorswim also provides robust charting capabilities and is known for its high-quality charts. It also supports options trading and includes options analysis tools.
  • TradingView has a more user-friendly and modern interface, while thinkorswim has a more advanced and customizable interface. Both platforms offer a web-based version as well as a desktop and mobile version.
  • TradingView offers different plans depending on the features and services needed, while thinkorswim comes with a TD Ameritrade or Schwab account and offers all the features and services without any limitations or restrictions.

Based on this comparison, TradingView may be the better choice for traders who want to trade a wider range of asset classes, especially cryptocurrencies, and have more flexibility in choosing their broker.

TradingView may also be the better choice for traders who want to use a wider range of charting tools and indicators, or who want to interact with other traders and learn from their ideas. TradingView may also be the better choice for traders who want to use a simple and modern interface that is easy to use and access from any browser.

Thinkorswim may be the better choice for traders who are already TD Ameritrade or Schwab customers or those who want to trade options. Thinkorswim may also be the better choice for traders who want to use options analysis tools.

However, the final decision should be based on your individual preferences and trading requirements. You can try out both platforms and see which one suits you better. You can also read more articles on TradingView compared to other platforms like TradingView vs. NinjaTrader, TradingView vs. Webull, Barchart vs. TradingView, or TradingView vs. Finviz to learn more about their features and benefits.

FAQ: TradingView vs Thinkorswim

Is TradingView compatible with TD Ameritrade?

No, TradingView is not compatible with TD Ameritrade. TradingView works with a variety of different brokers, but TD Ameritrade is not one of them. On the contrary, Thinkorswim is exclusive to TD Ameritrade and Schwab clients and only allows trading through a TD Ameritrade or Schwab account.

Is TradingView the best charting tool?

TradingView is widely regarded as one of the best charting tools available online. Technical analysts favor it for its wide range of technical indicators, drawing tools, and charting features that can be customized. It also supports the automation of trading strategies through its Pine Script programming language.

Can I trade directly from TradingView?

Yes, you can trade directly from TradingView if you have an account with one of the supported brokers. TradingView integrates with brokers such as Interactive Brokers, Tradovate, AMP Global, OANDA, Forex.com, and Gemini. You can also use paper trading to practice your skills without risking real money.

How much is TradingView a month?

TradingView offers both free and paid subscription plans. The free version provides access to basic features, while the paid plans unlock additional features and data. The paid plans range from $14.95 to $59.95 per month, depending on the level of service and billing frequency. If you use my link, you can get a discount on your premium subscription!

Do I need a broker for TradingView?

No, you can use TradingView’s charting features without a broker. However, if you want to place trades, you will need a brokereage account, which TradingView does not provide. TradingView does not provide brokerage services itself but rather connects you with various brokers that offer different asset classes and trading conditions

Before you go

If you want to keep educating yourself about trading, you must check out these posts as well:

thinkorswim vs. tastytrade

What is the Most Successful Options Strategy

Options Trading for Income: The Complete Guide

Mark Minervini’s Trading Strategy: 8 Key Takeaways

The Best Options Trading Books

TradingView Pricing Guide

The Best Laptops and Computers for Trading

The Best Monitors for Trading

How to Get a TradingView Free Trial

The Best TradingView Indicators

TrendSpider vs. TradingView

TrendSpider Free Trial

TrendSpider Discount Code

Best Futures Prop Firms in 2024

The Best Futures Prop Firms

Apex Trader Funding

  • 100% Profit Split Up to $25K!
  • Manage Up to 20 Funded Accounts!
  • No Daily Loss Limits!

Use Coupon code: ZBCLJSEH for 80% off

Apex Trader Funding offers futures traders access to substantial capital through a single-step evaluation process.

Pros

  • 100% profit split up to $25k
  • One-time lifetime fee option for long-term cost savings
  • Up to 20 funded accounts

Cons

  • Complex trailing drawdown
  • 10-day trading requirement between payouts
  • Strict payout request windows (1st-5th and 15th-20th)

Apex Trader Funding supports a wide range of futures contracts and popular trading software like NinjaTrader and TradingView. With no daily loss limits, high profit splits (100% of the first $25,000, 90% thereafter), and the ability to manage up to 20 funded accounts, Apex provides a flexible environment for traders to scale their activities.

The firm’s trader-friendly features, including allowance for news trading and frequent payouts, make it an attractive option for both novice and experienced futures traders looking to grow their trading careers without risking personal capital.

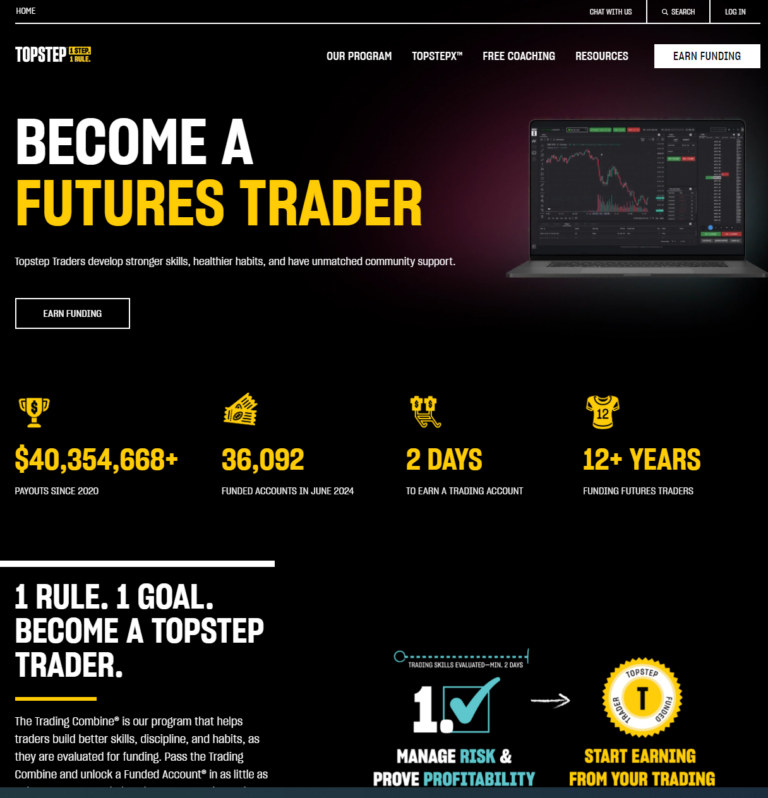
Topstep Trader

  • 100% Profit Split Up to $10K!
  • No Time Limits on Trading Combine!
  • Extensive Educational Resources!

Funded accounts up to $150,000

Topstep Trader offers traders the opportunity to earn funded futures trading accounts without risking their own capital through a simulated Trading Combine program.

Pros

  • High profit sharing (100% up to $10,000, 90% after)
  • No time limits on Trading Combine
  • Extensive educational resources

Cons

  • Higher monthly subscription fees
  • Limited to futures trading only
  • Strict maximum loss limits

Topstep Trader provides a path to funded trading through their Trading Combine program. Traders pay monthly fees ($165-$375) during evaluation, with optional reset fees if needed. Upon passing, a one-time $149 Activation Fee grants a funded account. The funded account allows traders to keep their first $10,000 in profits and 90% thereafter, providing access to significant capital without personal financial risk.

Topstep uses two loss limits: the Daily Loss Limit and Maximum Loss Limit (MLL). The platform is ideal for experienced futures traders seeking larger capital without personal risk and those who can adhere to strict risk management rules.

Crypto Fund Trader

  • Up to $200,000 in Virtual Funds!
  • 80% Profit Split for Funded Traders!
  • Trade Crypto, Forex, Indices, Commodities, and Stocks!

Use code: platinum5 for 5% discount

Crypto Fund Trader is an evaluation services firm offering traders the opportunity to trade various financial instruments using virtual funds and generate real profits.

Pros

  • High leverage up to 1:100
  • Spreads from 0 pips
  • No time limit on evaluation

Cons

  • Two-phase evaluation process
  • 5% maximum daily loss limit
  • 10% maximum overall loss limit

Crypto Fund Trader offers a two-phase evaluation process. In Phase 1, traders aim for an 8% profit target, while Phase 2 requires a 5% profit target. Upon successful completion, traders gain access to a live account with an 80:20 profit split.

The platform provides various account sizes from $5,000 to $200,000, with one-time registration fees. Traders can use MetaTrader 5, CFT Platform, or Crypto Futures for trading, with access to cryptocurrencies, forex, indices, commodities, and stocks.

Apex Trader Funding vs. TopStep – Which is Best For You?

apex trader funding vs topstep trade

Do you want to try futures trading but have a fear of blowing up your account? In the fast-paced world of futures trading, proprietary trading firms have emerged as game-changers, offering traders the opportunity to access substantial capital without risking their own funds. 

With these platforms, you can earn significant profits without risking your own capital while also gaining valuable trading experience. Two of the biggest players in this arena are Apex Trader Funding and TopStep Trader.

I’m here to break down the key differences between these two popular prop firms. Whether you’re a seasoned trader looking to scale up your operations or a newcomer eager to test your skills in the futures market, this comprehensive comparison will help you navigate the unique features, pros, and cons of Apex Trader Funding and TopStep Trader.

Apex Trader Funding

  • 100% Profit Split Up to $25K!
  • Manage Up to 20 Funded Accounts!
  • No Daily Loss Limits!
Get 80% Off Apex Now!

TopStep Trader

  • Keep 100% of First $10K!
  • Extensive Educational Resources!
  • No Time Limits on Evaluation!
Visit Site

Pros and Cons of Apex and Topstep

Apex Trader Funding

Pros

  • 100% profit split up to $25k
  • One-time lifetime fee option for long-term cost savings
  • Up to 20 funded accounts

Cons

  • Complex trailing drawdown
  • 10-day trading requirement between payouts
  • Strict payout request windows (1st-5th and 15th-20th)

TopStep Trader

Pros

  • High profit sharing (100% up to $10,000, 90% after)
  • No time limits on Trading Combine
  • Extensive educational resources

Cons

  • Higher monthly subscription fees
  • Limited to futures trading only
  • Strict maximum loss limits

Comparing Apex and TopStep Key Features

Platform Pricing Profit Share Best For
Apex Trader Funding Get 80% Off $29-$136 per month 100% up to $25,000, then 90% Best for lifetime payment for funded accounts
TopStep Trader Visit Site $165-$375 per month 100% up to $10,000, then 90% Best for structured evaluation and extensive educational resources

Overview of Apex Trader Funding

Apex Trader Funding offers futures traders a unique opportunity to access substantial capital through a streamlined, single-step evaluation process. This platform supports a broad range of futures contracts and integrates seamlessly with popular trading software such as NinjaTrader and TradingView, making it highly versatile for various trading styles.

Key Features of Apex Trader Funding

  • Pricing: Apex Trader Funding offers competitive pricing, with monthly fees ranging from $29 to $136.
  • Reset Cost: If traders need to reset their evaluation, the cost is $80.
  • Profit Share: Traders can keep 100% of the first $25,000 in profits, and 90% thereafter, providing a highly attractive profit-sharing model.
  • Tradeable Assets: The platform supports a wide array of futures contracts, including Equity Futures, Foreign Exchange Futures, Agricultural Futures, Energy Futures, Interest Rate Futures, Metals Futures, and Crypto Futures.
  • Trading Platforms: Apex Trader Funding is compatible with numerous trading platforms, including Tradovate, Rithmic, NinjaTrader 8, ATAS, Bookmap, Quantower, Jigsaw Trading, Finamark, Edge Clear EdgePro X, MotiveWave, VolFix, Wealthcharts, and TradingView Charting.
  • Risk Management: Traders benefit from a trailing drawdown mechanism based on the highest profit point, which provides flexibility while ensuring disciplined trading practices.

Trader-Friendly Features of Apex Trader Funding

  • No Daily Loss Limits: Unlike many other prop firms, Apex Trader Funding does not impose daily loss limits, allowing traders more flexibility in their trading strategies.
  • High Profit Splits: With 100% profit retention up to $25,000 and 90% thereafter, traders can maximize their earnings.
  • Manage Multiple Accounts: Traders can manage up to 20 funded accounts simultaneously, providing ample opportunities to scale their trading activities.
  • Frequent Payouts: Apex Trader Funding offers bi-monthly payouts, ensuring that traders have regular access to their profits.

Apex Trader Funding’s combination of flexible rules, high profit potential, and robust support for various trading platforms makes it an attractive option for traders looking to grow their trading careers without risking personal capital.

Overview of TopStep Trader

TopStep Trader is a leading proprietary trading firm that provides traders with the opportunity to earn funded futures trading accounts without risking their own capital. The journey begins with the Trading Combine, a simulated trading program where traders must demonstrate their skills and adhere to specific risk management rules.

Key Features of TopStep Trader

  • Pricing: Monthly subscription fees range from $165 to $375.
  • Reset Cost: Traders can reset their evaluation for $49 to $149, depending on the account size.
  • Profit Share: Traders keep 100% of their first $10,000 in profits and 90% thereafter, offering a highly competitive profit-sharing model.
  • Tradeable Assets: The platform supports a variety of futures contracts, including Equity Futures, Forex Futures, Agricultural Futures, Energy Futures, Interest Rate Futures, and Metals Futures.
  • Trading Platforms: TopStep Trader is compatible with multiple trading platforms, including TopStepX, NinjaTrader, Tradovate, Quantower, Bookmap, CTS, Sierra Chart, and TradingView Charting.
  • Risk Management: The platform employs strict risk management rules, including a Daily Loss Limit and a Maximum Loss Limit, to ensure disciplined trading.

Trader-Friendly Features of TopStep Trader

  • Educational Resources: TopStep Trader offers extensive educational resources, including webinars, podcasts, and daily market analysis, to help traders improve their skills and knowledge.
  • Community Support: Traders can benefit from a supportive community and access to professional insights through TopStepTV™, which broadcasts live trading sessions and market analysis.
  • Structured Evaluation Process: The Trading Combine is a two-step evaluation process designed to test traders’ ability to manage risk and generate profits. Successful traders are rewarded with a funded account to trade live futures markets.
  • High Profit Sharing: With a profit-sharing model that allows traders to keep 100% of their first $10,000 in profits and 90% thereafter, TopStep Trader offers a lucrative opportunity for successful traders.

TopStep Trader’s combination of rigorous evaluation, comprehensive educational resources, and strong community support makes it an attractive option for traders looking to advance their careers in futures trading without risking their own capital.

Who is Apex Trader Funding Best For?

Apex Trader Funding is perfect for futures traders looking to amplify their trading potential without risking their own capital. It caters to both newcomers and seasoned professionals who can consistently execute profitable strategies while managing risk effectively.

The platform is particularly well-suited for active traders who thrive on market volatility and appreciate the flexibility to trade during news events, provided it aligns with their strategy and can be explained. 

Apex is also ideal for those who prefer the option of paying a one-time lifetime fee instead of monthly payments once they unlock a funded account. Additionally, it supports traders aiming to grow multiple accounts simultaneously, making it an attractive choice for those focused on rapid account growth and scalability.

Who is TopStep Trader Best For?

TopStep Trader is tailored for experienced futures traders who seek to leverage larger capital without risking their own funds. It is particularly suitable for those who prefer the structure of monthly subscription fees over one-time charges during the evaluation phase.

This platform is ideal for traders who can adhere to strict risk management rules, value comprehensive educational resources, and appreciate high profit-sharing rates. TopStep Trader focuses exclusively on futures trading, offering a variety of contracts, including forex futures. It is best suited for disciplined traders who thrive under clear guidelines and aim to enhance their trading skills through a wealth of educational materials.

Apex vs. TopStep Pricing Structures Compared

Platform Monthly Fee Reset Cost Platform Options Lifetime Fees Funded Account
Apex Trader Funding Get 80% Off $29-$136 $80 Rithmic PA: $85/month
Tradovate PA: $105/month
Rithmic: $130-$340
Tradovate: $150-$360
Lifetime or monthly payments required after passing evaluation
TopStep Trader Visit Site $165-$375 $49-$149 (depends on account size) Pricing doesn’t change based on platform selection N/A $149 one-time Activation Fee

TopStep Trader Pricing Explained

TopStep Trader provides a unique pathway to funded trading via their Trading Combine program. The evaluation phase involves monthly subscription fees ranging from $165 to $375, with the option to reset for $49 to $149 if necessary.

Successfully completing the program leads to a funded account, accessible after paying a one-time $149 Activation Fee. At this point, monthly subscription fees cease, though traders become responsible for data and platform expenses.

The funded account structure is designed to reward traders generously, allowing them to retain 100% of their first $10,000 in profits, followed by a 90% share thereafter. This model enables traders to access substantial trading capital without putting their personal finances at risk.

Apex Trader Funding Pricing Explained

Apex Trader Funding provides two payment options for Performance Accounts (PA): monthly fees or a one-time lifetime fee. For those opting for monthly fees, the cost is $85 for Rithmic PA and $105 for Tradovate PA. The lifetime fee varies based on account size, ranging from $130 to $340 for Rithmic and $150 to $360 for Tradovate.

After passing the Evaluation Account, traders must sign PA contract documents and make the required payment. It’s important to note that once a payment option (monthly or lifetime) is selected for a specific PA account, it cannot be changed. The payment link will be available through the ATF.com Dashboard in the Signatures tab.

Apex Risk Management Rules

Apex Trader Funding allows traders to maximize their contract limits based on their plan, with no daily maximum drawdown restrictions. Each plan comes with a specific trailing drawdown, which varies depending on the account size. For instance, a $50K plan starts with a trailing drawdown of $2,500 below the initial balance.

In funded accounts, the trailing drawdown ceases once the liquidation threshold reaches $100 above the initial balance (e.g., $50,100 for a $50K plan). Static accounts feature a fixed drawdown that remains unchanged. The trailing drawdown follows the highest profit point by a set amount, and traders must monitor this in real time to avoid failing the evaluation.

It’s important to note that while Apex permits trading during news events, such trades must align with your strategy and be justifiable rather than speculative gambles.

TopStep Trader Risk Management Rules

TopStep employs a dual-tiered risk management system:

  • Daily Loss Limit: This varies by account size ($1,000 for $50K, $2,000 for $100K, $3,000 for $150K accounts). If exceeded, it triggers an automatic position closure and halts trading until 5 PM CT.
  • Maximum Loss Limit (MLL): This is calculated based on the end-of-day account balance and has the potential to increase as profits grow.

Importantly, breaching either of these limits doesn’t result in account closure. Trading can resume the following day, providing a balance between trader flexibility and prudent risk management practices.

Apex vs. TopStep Profit Share Details

  • TopStep Trader: 100% profit up to $10,000, then 90%.
  • Apex Trader Funding: 100% profit up to $25,000, then 90%.

Apex Trader Funding vs. TopStep Trader – The Bottom Line

Both Apex Trader Funding and TopStep Trader offer unique advantages for traders looking to access significant capital without risking their own funds. Here’s a quick recap of their key differences and similarities:

Key Differences

  • Evaluation Process: Apex Trader Funding features a single-step evaluation, while TopStep Trader employs a two-step Trading Combine.
  • Profit Sharing: Apex offers 100% profit up to $25,000 and 90% thereafter, whereas TopStep provides 100% up to $10,000 and 90% thereafter.
  • Risk Management: Apex has no daily loss limits and uses a trailing drawdown, while TopStep enforces strict daily and maximum loss limits.
  • Pricing Structure: Apex allows for monthly or one-time lifetime fees, while TopStep charges monthly subscription fees during the evaluation phase.
  • Tradeable Assets: Both platforms support various futures contracts, but Apex also includes crypto futures.

Similarities

  • Both platforms offer high profit-sharing rates.
  • Both provide access to a wide range of futures contracts.
  • Both cater to traders who are looking to trade without personal financial risk.

Guidance for Traders

  • Choose Apex Trader Funding if: You prefer a single-step evaluation process, want flexibility in trading news events (aligned with your strategy), and are looking to manage multiple funded accounts simultaneously. The option for a one-time lifetime fee might also be appealing if you prefer not to deal with recurring monthly payments.
  • Choose TopStep Trader if: You value a structured evaluation process with strict risk management rules, appreciate extensive educational resources, and prefer a monthly subscription model during the evaluation phase. TopStep is also ideal if you’re focused solely on futures trading, including forex futures.

When deciding between these two platforms, consider your trading style, goals, and preferences. Whether you thrive in a flexible trading environment or prefer a structured approach with comprehensive support, both Apex Trader Funding and TopStep Trader offer robust solutions to help you grow your trading career without risking your own capital.

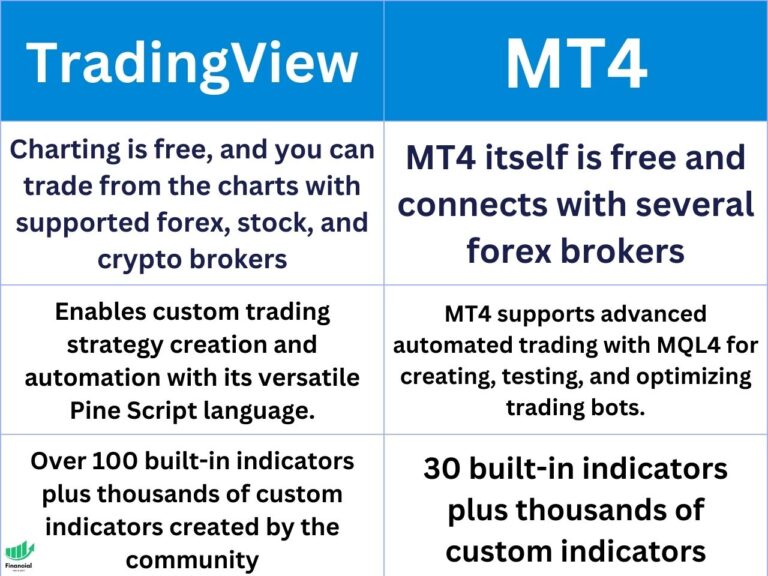
TradingView vs. MT4 Charting Tools Compared

tradingview vs mt4 table comparison

TradingView and MT4 are both trading platforms that allow you to access the forex market, but they are not brokers. You still need to open an account with a broker that supports these platforms and execute your trades through them.

However, these platforms are not exactly the same. They have different features, advantages, and disadvantages that you should consider before choosing one over the other. In this article, we will mainly focus on the charting features of TradingView and MT4.

Platform Pricing Trading Tools Indicators
TradingView Free Trial Charting is free, and you can trade from the charts with supported forex, stock, and crypto brokers Enables custom trading strategy creation and automation with its versatile Pine Script language Over 100 built-in indicators plus thousands of custom indicators created by the community
MT4 Visit site MT4 itself is free and connects with several forex brokers Supports advanced automated trading with MQL4 for creating, testing, and optimizing trading bots More than 30 built-in indicators plus thousands of custom indicators

TradingView Overview

TradingView is a web-based charting platform that was launched in 2011. It has quickly become one of the most popular and widely used charting tools among traders of all levels and markets. TradingView offers more than just forex trading; you can also access stocks, futures, cryptocurrencies, and other instruments on its platform.

TradingView has a modern and user-friendly interface that allows you to customize your charts with various tools, indicators, drawing tools, and timeframes. You can also access a large community of traders who share their ideas, strategies, and analysis on the platform.

TradingView Limited Time Offer!

Exclusive Deal: 30-Day FREE Premium Access + Bonus Credit

Don’t Miss Out – Sign up for TradingView Now!

  • Advanced Charts
  • Real-Time Data
  • Track all Markets
CLAIM YOUR FREE TRIAL

MT4 Overview

MT4 is a downloadable software platform that was launched in 2005 by MetaQuotes. It is one of the oldest and most widely used trading platforms in the forex industry. MT4 is designed specifically for forex trading, and it offers both trading and analytical features.

MT4 has a simple and customizable interface that allows you to create your own charts with various technical analysis tools, indicators, scripts, and expert advisors (EAs). You can also backtest your strategies and optimize your parameters on the platform.

tradingview vt mt4 image
MT4

Platform Indicators Backtesting Stock Screeners Broker Availability Other Features
TradingView Free Trial Over 100 built-in indicators plus custom indicators with Pine Script. Ability to backtest, paper trade, and optimize trading strategies. Advanced screeners to filter several assets based on many criteria Support various brokers, including IBKR, Forex.com, Oanda, and more. Heatmap, economic calendars, alerts, paper trading, backtesting, mobile app.
MetaTrader 4 Visit site 30 built-in indicators plus the ability to use thousands of custom indicators. Ability to backtest using the strategy tester and trading bots. No stock screeners are available. Supports brokers, including Oanda, Forex.com, FXCM, and more. Free trading robots, expert advisors (EA), mobile trading

TradingView Pros & Cons

Pros

  • TradingView is free to use and sign up. However, if you want to unlock more advanced features, such as more indicators, alerts, multiple charts per layout, etc., you can upgrade to one of its paid plans: Essential, Plus, or Premium.
  • TradingView offers a free trial to test all of its premium features for 30 days. You can cancel anytime if you are not satisfied with the service.
  • TradingView has a wide range of instruments that you can trade on its platform. You can access more than just forex; you can also trade stocks, futures, cryptocurrencies, commodities, indices, bonds, CFDs, and more.
  • TradingView has a modern and intuitive interface that makes it easy to use and navigate. You can customize your charts with various tools, indicators, drawing tools, timeframes, layouts, themes, etc.
  • TradingView has more advanced charting tools and indicators than MT4. You can access over 100 built-in indicators, including some unique ones created by TradingView users. You can also create your own indicators using Pine Script, a programming language designed for TradingView.
  • TradingView has more features that enhance your trading experience, such as heatmaps, screeners, economic calendars, watchlists, trading alerts, paper trading, backtesting, etc.

Cons

  • TradingView isn’t great for trading options, but you can view options chains and risk diagrams.
  • You will need to execute your trades through a broker that supports TradingView or trade on a separate broker while using TradingView for charts only.

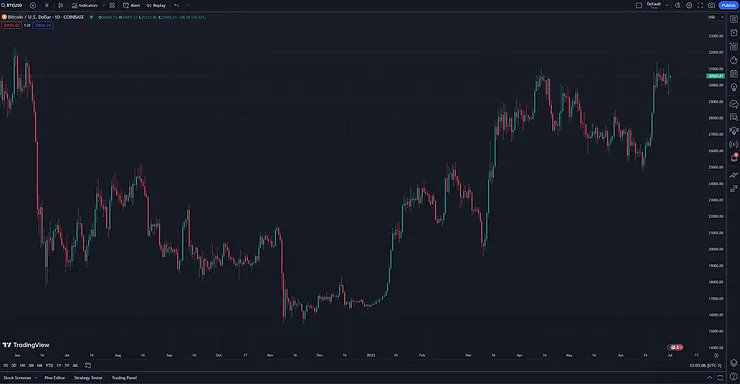
tradingview vs mt4 tv chart
TradingView Chart

MT4 Pros & Cons

Pros

  • MT4 is free to download and use. However, you will need to open an account with a broker that supports MT4 and execute your trades through them.
  • MT4 is reliable and stable. It has been around for a long time and has proven its performance and functionality in the forex market. It rarely crashes or freezes, and it can handle high volumes of data and orders.
  • MT4 supports automated trading. You can use EAs to automate your trading strategies and execute them on the platform. You can also backtest your EAs and optimize your parameters on the platform.

Cons

  • MT4 is outdated and limited. It has not been updated or improved much since its launch in 2005. It lacks some of the features and tools that modern traders need, plus it looks old.
  • MT4 has a lack of instruments. It only supports forex trading, and it does not offer access to other markets or instruments, such as stocks, futures, cryptocurrencies, etc.
  • MT4 has a lack of chart timeframes compared to TradingView. On MT4, you can only access nine standard timeframes: M1, M5, M15, M30, H1, H4, D1, W1, and MN. On TradingView, you can access more than 20 timeframes, including custom ones, such as M2, M3, M10, H2, H8, etc. You can also access tick charts on TradingView, which show every price movement in the market.
  • MT4 has a lack of indicators compared to TradingView. On MT4, you can only access about 30 built-in indicators, and some of them are outdated or redundant. On TradingView, you can access over 100 built-in indicators, including some unique ones created by TradingView users. You can also create your own indicators using Pine Script, a programming language designed for TradingView.
  • MT4 has an outdated and complex interface that makes it hard to use and navigate. You may need to spend some time and effort to learn how to use the platform and customize it to your preferences.

TradingView vs MT4 – Bottom Line

TradingView and MT4 are both popular and widely used trading platforms for forex traders. However, they have different features, advantages, and disadvantages that you should consider before choosing one over the other.

TradingView is a web-based charting platform that offers more advanced charting tools and indicators than MT4. It also offers access to more instruments and markets than MT4. It has a modern and user-friendly interface that makes it easy to use and navigate. It also has a large and active community of traders who share their ideas and analysis on the platform.

MT4 is a downloadable software platform that offers both trading and analytical features for forex trading. It is reliable and stable, and it supports automated trading with EAs. It is customizable and flexible, and it supports multiple languages and platforms. However, it is outdated and limited in terms of charting tools, indicators, timeframes, and instruments.

Ultimately, the best platform for you depends on your personal preferences, trading style, and goals. However, it is clear that TradingView is a better all around trading and charting platform.

If you want to try TradingView for yourself and see how it compares to MT4, you can sign up for a free account here and get a free trial of TradingView. When you use my affiliate link, you will also get a discount on your membership!

TradingView Limited Time Offer!

Exclusive Deal: 30-Day FREE Premium Access + Bonus Credit

Don’t Miss Out – Sign up for TradingView Now!

  • Advanced Charts
  • Real-Time Data
  • Track all Markets
CLAIM YOUR FREE TRIAL

I hope this article has helped you understand the differences between TradingView and MT4 charting tools and make an informed decision on which one is best for you.

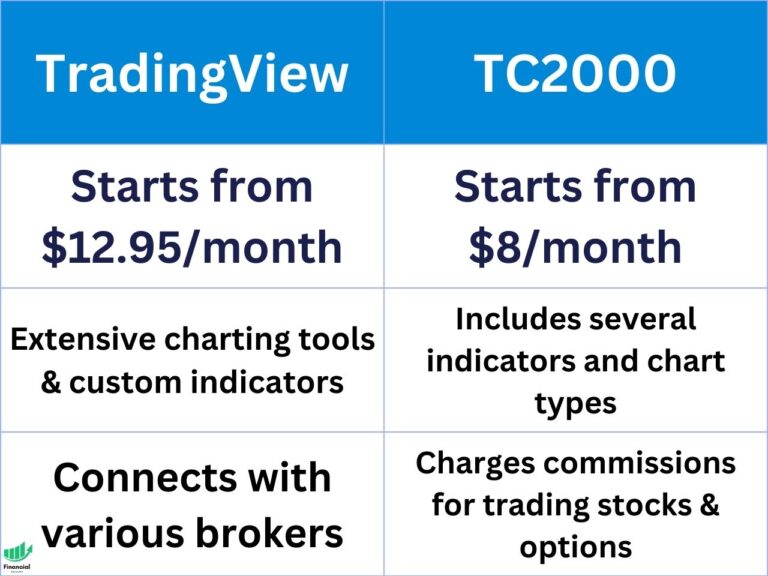
TradingView vs. TC2000: Which Platform is Better for You?

tradingview vs tc2000 table

If you are looking for a powerful and versatile platform to analyze and trade stocks and options, you may have come across TradingView and TC2000.

In this article, we will review TradingView and TC2000 in detail and help you decide which platform suits your needs and preferences.

TradingView

  • Price: Free-$60/month
  • Extensive charting tools
  • Custom indicators with Pine Script
  • Connects with various brokers
Start Free Trial

TC2000

  • Price: $8-$50/month
  • Basic volume profile and indicators
  • Several chart types available
  • Commissions for stock & options
Get $25 Off

Overview of TradingView

TradingView is a web-based platform that combines multi-asset charting, screening, backtesting, and trading. TradingView covers stocks, bonds, forex, commodities, indices, and cryptocurrencies, making it suitable for traders and investors of different markets and styles. TradingView also integrates with several brokers, allowing you to trade directly from the charts with real-time data and execution.

TradingView has a freemium model, meaning you can use some of its features for free, but you need to upgrade to a paid plan to access more advanced tools and functionalities.

TradingView offers four subscription plans: Basic (free), Essential ($14.95/month), Plus ($29.95/month), and Premium ($59.95/month). The main differences between the plans are the number of indicators, alerts, charts, watchlists, and devices you can use simultaneously, as well as the availability of features like extended trading hours, custom intervals, intraday data, volume profile indicators, priority customer support, and more.

Overview of TC2000

TC2000 is a desktop-based platform that specializes in stock and options charting, scanning, and trading. It was created by Worden Brothers in 1993 and has won several awards for its software quality and customer service. TC2000 covers US and Canadian stocks and options, as well as some ETFs and mutual funds.

TC2000 has a subscription-based model, meaning that you need to pay a monthly or annual fee to use the platform. TC2000 offers three subscription plans: Silver ($9.99/month), Gold ($29.99/month), and Platinum ($89.99/month). You will get a discount if you purchase an annual subscription. TC2000 also still charges a fee for each stock and option trade you make.

TradingView vs. TC2000 Features Compared

Feature TradingView Free Trial TC2000 Get $25 Off
Pricing $0-$59.95 per month + free trial with my affiliate link $8-$50 per month + $25 off with my affiliate link
Assets and Markets Stocks, bonds, forex, commodities, indices, and cryptocurrencies from around the world US and Canadian stocks and options, as well as some ETFs and mutual funds
Charting Hundreds of indicators, drawing tools, and chart types; custom intervals; volume profile indicators; Pine Script for creating custom indicators and strategies Hundreds of indicators, drawing tools, and chart types; standard intervals; PCF for creating conditions and formulas
Screening Predefined filters and indicators; Pine Script for creating custom screens Custom conditions and formulas using PCF; EasyScan for scanning multiple watchlists and conditions simultaneously
Trading Supports multiple brokers that offer commission-free or low-cost trading for different assets; paper trading feature Charges $1 + $0.005 per share and $1 + $0.65 per contract for options
Backtesting Pine Script for creating and backtesting strategies; detailed report with performance metrics, trades list, equity curve, drawdowns, etc.; optimization feature PCF for creating and backtesting strategies; detailed report with number of trades, win rate, average gain/loss, maximum drawdown, etc.; optimization feature

TradingView and TC2000 have many features in common, but they also have some significant differences that may affect your choice depending on your trading goals and preferences. Here are some of the main features that distinguish these two platforms:

Assets and Markets

TradingView covers a wider range of assets and markets than TC2000. TradingView supports stocks, bonds, forex, commodities, indices, and cryptocurrencies from around the world, while TC2000 only supports US and Canadian stocks and options, as well as some ETFs and mutual funds. This means that if you want to trade or invest in other markets or assets than stocks and options, TradingView may be a better option for you.

Charting

Both platforms offer excellent charting capabilities, with hundreds of indicators, drawing tools, and chart types to choose from. However, TradingView has some advantages over TC2000 in terms of charting. For example,

TradingView allows you to create custom intervals, such as 2-minute or 7-hour charts, while TC2000 only offers standard intervals, such as 1-minute or 1-day charts. TradingView also supports footprint and market profile charts, which show the distribution of volume at different price levels, while TC2000 does not.

tradingview vs tc2000 tv chart

Screening

Both platforms have powerful screening tools that allow you to scan the market for stocks and options that meet your criteria. However, TC2000 has some advantages over TradingView in terms of screening. You can read my full article about the TradingView stock screener for more information.

tradingview stock screener

For example, TC2000 allows you to create custom conditions and formulas using PCF, while TradingView only lets you use predefined filters and indicators. TC2000 also has a feature called EasyScan, which lets you scan multiple watchlists and conditions simultaneously and see the results in real-time.

TradingView does not have a similar feature. Moreover, TC2000 has a feature called Options Scanner, which lets you scan the market for options strategies that meet your criteria, such as covered calls, naked puts, bullish spreads, etc. TradingView does not have a similar feature.

Backtesting

TradingView has a clear edge over TC2000 in terms of backtesting. TradingView allows you to backtest your strategies using Pine Script and see the results in a detailed report that shows the performance metrics, trades list, equity curve, drawdowns, etc. You can also optimize your strategies using different parameters and see how they affect the results. TC2000 also allows you to backtest your strategies using PCF, but the results are more limited and less informative than TradingView’s. You can only see the number of trades, win rate, average gain/loss, maximum drawdown, etc. You cannot optimize your strategies or see the equity curve or trades list.

tradingview backtest

Trading

Both platforms allow you to trade directly from the charts using real-time data and execution. However, TradingView has some advantages over TC2000 in terms of trading. For example, TradingView supports multiple brokers, such as TradeStation, Oanda, Interactive Brokers, Webull, etc. This means that you have more choices and flexibility when it comes to choosing a broker with TradingView.

TC2000 itself is a broker, but it does not offer free equity trading like most modern brokers. TradingView also supports trading stocks, forex, futures, and crypto globally, while TC2000 only supports trading stocks and options in the US and Canada. Moreover, TradingView has a feature called Paper Trading, which lets you practice your trading skills and strategies with virtual money and real-time data. TC2000 does not have a similar feature.

Usability

Both platforms are easy to use and have intuitive and user-friendly interfaces. However, TradingView has some advantages over TC2000 in terms of usability. For example, TradingView is web-based, meaning that you can access it from any device and browser without downloading or installing anything. TC2000 is desktop-based, meaning that you need to download and install it on your PC or Mac.

TradingView also has a mobile app for iOS and Android devices, while TC2000 does not. Moreover, TradingView has a feature called Social Network, which lets you interact with other traders and investors from around the world. You can share your charts and ideas, follow other users, comment on their posts, join groups and chat rooms, etc. TC2000 does not have a similar feature.

TradingView vs. TC 2000 Charting

Both TradingView and TC2000 offer excellent charting capabilities, with hundreds of indicators, drawing tools, and chart types to choose from. However, TradingView has some advantages over TC2000 in terms of charting that make it superior.

First of all, TradingView allows you to create custom intervals, such as 2-minute or 7-hour charts, while TC2000 only offers standard intervals, such as 1-minute or 1-day charts. Custom intervals can help you fine-tune your analysis and trading according to your preferred time frame and style.

Secondly, TradingView supports volume profile indicators, which show the distribution of volume at different price levels. Volume profile indicators can help you identify areas of support and resistance, as well as gauge the strength and weakness of price movements. TC2000 does not support volume profile indicators.

tc2000 charting

TradingView vs. TC2000 Pricing

Both TradingView and TC2000 have similar pricing ranges, but TradingView offers more value for money than TC2000.

TradingView has a freemium model, meaning that you can use some of its features for free, but you need to upgrade to a paid plan to access more advanced tools and functionalities.

TradingView offers four subscription plans: Basic (free), Essential ($14.95/month), Plus ($29.95/month), and Premium ($59.95/month). The main differences between the plans are the number of indicators, alerts, charts, watchlists, and devices you can use simultaneously, as well as the availability of features like extended trading hours, custom intervals, intraday data, volume profile indicators, priority customer support, and more.

tradingview annual pricing

TC2000 has a subscription-based model, meaning that you need to pay a monthly or annual fee to use the platform. TC2000 offers three subscription plans: Silver ($9.99/month), Gold ($29.99/month), and Platinum ($89.99/month).

tc2000 pricing
TC2000 Pricing

Another thing to consider is the trading commissions. Some of the brokers that TradingView supports offer commission-free trading for stocks and ETFs and low fees for options and other assets. For example, TradeStation charges $0 per trade for stocks and ETFs and $0.50 per contract for options.

On the other hand, TC2000 charges $4.95 per trade for stocks and ETFs and $2.95 plus $0.65 per contract for options. This means that if you trade frequently or in large volumes, TradingView may save you a lot of money in commissions compared to TC2000.

TC2000 Special Offer!

Exclusive Deal: $25 Off Your First Month

Limited Time Offer – Join TC2000 Today!

  • Powerful Charting
  • EasyScan Technology
  • Custom Indicators
CLAIM YOUR DISCOUNT

TradingView vs. TC2000 – Which is Best For You?

Both TradingView and TC2000 are excellent platforms that offer advanced charting, screening, and trading features. However, TradingView is clearly superior based on pricing and charting.

TradingView offers free plans and a wide range of brokers you can trade from that charge much lower fees than TC2000. Additionally, if you want to trade or invest in other markets or assets than stocks and options, such as forex, commodities, or cryptocurrencies, TradingView may be a better option for you.

TradingView is also better If you want to backtest and optimize your strategies using a simple and user-friendly programming language. TradingView has a feature called Pine Script, which lets you create your own indicators and strategies using a simple programming language.

You can also backtest and optimize your strategies using different parameters and see how they affect the results. TC2000 also has a scripting language called PCF (Personal Criteria Formula), but it is less user-friendly than Pine Script.

How to Get a TradingView Free Trial

If you are interested in trying out TradingView for yourself, you can sign up for a free trial using my affiliate link. You will get access to all the features and functionalities of the platform for 30 days. You can also cancel your subscription at any time if you are not satisfied with the service.

TradingView Limited Time Offer!

Exclusive Deal: 30-Day FREE Premium Access + Bonus Credit

Don’t Miss Out – Sign up for TradingView Now!

  • Advanced Charts
  • Real-Time Data
  • Track all Markets
CLAIM YOUR FREE TRIAL

FAQ

Q: What is the difference between TradingView and TC2000?

A: TradingView is a charting platform, while TC2000 is a brokerage. However, you can connect some brokers to trade directly on TradingView.

Q: Is TC2000 good for day trading?

A: TC2000 can be a good platform for day trading stocks and options in the US and Canada, as it offers one of the best live trading platforms available anywhere.

Q: Is TradingView the best charting tool?

A: TradingView is widely regarded as one of the best charting tools in the industry, offering hundreds of indicators, drawing tools, and chart types to choose from.

Q: Do you need a broker with TradingView?

A: TradingView is not a standalone broker, meaning that you cannot trade directly with TradingView without connecting to a broker. TradingView supports multiple brokers that offer trading for different assets and markets. However, you do not need one to use the charting, backtesting, or screener.

Q: Can I backtest on TC2000?

A: TC2000 allows you to backtest your strategies using PCF (Personal Criteria Formula), a scripting language that lets you create custom conditions and formulas. You can apply your PCF to any watchlist or scan it and see how it performed in the past.

However, TC2000’s backtesting capabilities are more limited and less informative than other platforms, such as TradingView. You can only see the number of trades, win rate, average gain/loss, maximum drawdown, etc. You cannot optimize your strategies or see the equity curve or trades list.

Q: Is TC2000 screener free?

A: TC2000 screener is not free. You need to pay a monthly or annual fee to use the platform and access its screening features.

Before you go

If you want to keep educating yourself about trading, you must check out these posts as well:

TC2000 Discount Code

TC2000 vs. TrendSpider

TC2000 vs. Trade Ideas

TradingView Pricing Guide

How to Get a TradingView Free Trial

The Best TradingView Indicators

TradingView vs. Coinigy: Which is Best for You?

tradingviewvscoinigy

TradingView and Coinigy are two popular platforms used by traders to trade and perform technical analysis. In this article, we will compare TradingView and Coinigy to help you decide which platform is better for you.

Platform Pricing Charting Tools Markets Supported Other Features
TradingView Free Trial Free – $59.95 per month Free trial for premium access HTML5 charts with more than 50 intelligent drawing tools Bonds, stocks, currencies, commodities, indices, cryptocurrencies, CFDs, and futures Pine Script language, backtesting, custom indicators
Coinigy Visit site Free trial – $99.99 per month More than 75 technical indicators 46 crypto exchanges, 19,239 markets, and 4,805 cryptocurrencies Real-time API and 3rd party integrations

Overview of TradingView and Coinigy

TradingView

TradingView is a platform designed to provide real-time information and market insights for stocks, crypto, forex, and more. It is a charting and trading platform where you can gain access to some of the best technical analysis tools and several markets all in one platform.

tradingviewvscoinigy

TradingView Limited Time Offer!

Exclusive Deal: 30-Day FREE Premium Access + Bonus Credit

Don’t Miss Out – Sign up for TradingView Now!

  • Advanced Charts
  • Real-Time Data
  • Track all Markets
CLAIM YOUR FREE TRIAL

Coinigy

Coinigy, on the other hand, mainly focuses on crypto trading. They were catapulted to the top of the industry by the cryptocurrency wave that swept across the world just a few years ago. The team behind this service seems focused on introducing a paradigm shift in the global financial industry.

User Interface and Design

TradingView

TradingView has a highly intuitive user interface that makes it easy for users to navigate the platform. They also provide amazing heatmaps you can use for free. Additionally, TradingView is completely free to use if you just want charting. There are tons of free indicators you can use, and some advanced paid indicators you must have a subscription for as well.

Coinigy

Coinigy also has a user-friendly interface that allows traders to manage several accounts at more than a dozen cryptocurrency exchanges through a single app.

Charting and Technical Analysis Tools

TradingView

When it comes to charting tools, TradingView seems to have an upper hand with its HTML5 charts. The charts pack more than 50 intelligent drawing tools, and users can choose from many different chart types ranging from spread charts, line break, KAGI, and RENKO to PNF charts. Users can even adjust the system to accommodate multiple chart layouts or have multiple symbols on the chart.

Coinigy

Users can trade directly from the charting platform of their favorite exchanges with Coinigy. The platform has more than 45 exchanges so far and access to more than 75 technical indicators.

tradingview vs coinigy image
Coinigy

Market Data and Integration

TradingView provides real-time information and market insights for traders. Users can analyze bonds, stocks, currencies, commodities, indices, cryptocurrencies, CFDs, and futures. You can also build your own strategies with Pine Script and backtest them using TradingView’s backtesting software.

Coinigy allows you to access a real-time API, volume alerts, and use various third-party integrations. Coinigy also allows traders to access and chart 46 crypto exchanges, 19,239 markets, and 4,805 cryptocurrencies all from a single app.

Mobile Experience

Both TradingView and Coinigy have mobile apps available for users. However, the TradingView app is a bit easier to use and allows you to track stocks, crypto, forex, and more.

Pricing and Plans

TradingView offers a free plan as well as paid plans ranging from $12.95 to $59.95 per month. You can also get a free trial and a discount on your TradingView subscription using our affiliate link! Coinigy offers a free 30-day trial followed by a monthly subscription fee from $18 to $99 per month, depending on the current deals.

TradingView Limited Time Offer!

Exclusive Deal: 30-Day FREE Premium Access + Bonus Credit

Don’t Miss Out – Sign up for TradingView Now!

  • Advanced Charts
  • Real-Time Data
  • Track all Markets
CLAIM YOUR FREE TRIAL

TradingView vs. Coinigy | Bottom Line

Both TradingView and Coinigy are great platforms for traders. TradingView seems to have an upper hand when it comes to charting tools, while Coinigy offers more options for trading cryptocurrencies. Ultimately, the choice between the two platforms will depend on your individual needs as a trader.

Before you go

If you want to keep educating yourself about personal finance, you must check out these posts as well:

What is the Most Successful Options Strategy

Options Trading for Income: The Complete Guide

Mark Minervini’s Trading Strategy: 8 Key Takeaways

The Best Options Trading Books

TradingView Pricing Guide

The Best Laptops and Computers for Trading

The Best Monitors for Trading

How to Get a TradingView Free Trial

The Best TradingView Indicators

TradingView vs. Investing.com: Which Platform is Better for You?

tradingviewvsinvestingcom

Two of the most popular and comprehensive platforms for traders are TradingView and Investing.com.

In this article, we will compare and contrast TradingView and Investing.com across various criteria, such as user interface, charting tools, market coverage, pricing, and more.

TradingView

  • Starting at $14.95/month
  • Extensive charting tools
  • Custom indicators
  • Ideal for active traders
Start Free Trial

Investing.com

  • Starting at $12.49/month
  • Extensive fundamental analysis
  • Uses TradingView for charting
  • Best for swing traders and investors
Visit Site

Overview of TradingView vs. Investing.com

TradingView and Investing.com are both online platforms that provide traders with various tools and resources for trading and investing.

They both have some core features and functionalities that make them popular and comprehensive platforms for traders. However, they also have some differences that make them unique and distinct from each other.

TradingView

TradingView is an online platform that was founded in 2011 by a group of traders and software developers. It is mainly focused on providing traders with interactive charts, advanced technical analysis tools, and social trading features.

TradingView has over 30 million monthly active users who use its platform to access real-time data from multiple sources, create custom indicators and strategies using pine script editor, backtest and optimize their trading systems using strategy tester, publish and share their trading ideas with other users, follow and copy other successful traders, and more.

TradingView Strengths

TradingView’s main strengths are its simplicity, elegance, and efficiency. It has a user-friendly interface that allows traders to easily navigate and customize their charts and tools. It also has a large and active community of traders who share their insights and feedback on various markets and instruments.

TradingView Weaknesses

TradingView’s main weaknesses are its limited data coverage and market insights. It does not cover some markets, such as options and futures, and it does not provide much news or fundamental analysis features.

Investing.com

Investing.com is an online platform that was founded in 2007 by a group of economists and entrepreneurs. It is mainly focused on providing traders with comprehensive data coverage, market insights, and portfolio management tools.

Investing.com has over 50 million monthly active users who use its platform to access real-time data from over 250 exchanges, historical data up to 20 years, global market coverage across 100+ countries, live news and analysis from various sources, and more.

Investing.com Strengths

Investing.com’s main strengths are its economic data and economic news. It has a user interface that allows traders to access a wide range of data and information from different markets and instruments.

Investing.com Weaknesses

Investing.com’s main weaknesses are its appearance and performance. It has a user interface that can be overwhelming and confusing for some users, especially beginners. It also has some issues with speed and reliability, especially on mobile devices.

Platform Charting Tools Data Coverage Pricing
TradingView Free Trial Offers advanced indicators, real-time data, backtesting, and custom indicators with Pine Script Real-time data offered for free whenever possible and fundamental screeners Plans start at just $12.95 per month
Investing.com Visit Site Minimal indicators, but the charts work fine and are real-time Extensive market research and recent market news is great Plans start at $12.49 per month

Charting and Technical Analysis Tools

TradingView and Investing.com have different charting and technical analysis tools that provide traders with different options and capabilities for charting and analysis. They both have some pros and cons that can make them more or less suitable for certain trading needs and preferences.

TradingView’s Charting and Technical Analysis Tools

tradingview vs investing.com tv chart
TradingView Chart With Market Profile

TradingView’s charting and technical analysis tools have the following features:

  • Interactive charts: TradingView allows users to create and manipulate interactive charts for their markets and instruments. Users can choose from various chart types such as line, candlestick, bar, area, etc. Users can also adjust the time frames from tick charts to 1 month.
  • Advanced indicators: TradingView allows users to apply and modify over 100 built-in technical indicators to their charts. Users can choose from indicators such as moving averages, oscillators, volume profile, Fibonacci retracements, etc. TradingView also offers several paid indicators.
  • Pine Script editor: TradingView allows users to create and edit their own custom indicators and strategies using the Pine Script editor. Pine Script is a programming language that is designed for trading purposes. Users can use pine script to code their own logic, formulas, conditions, and rules for their indicators and strategies.
  • Backtesting: TradingView allows users to backtest their custom indicators and strategies using historical data. Users can use TradingView’s backtesting tools to evaluate the performance and profitability of their indicators and strategies over time.
  • Strategy tester: TradingView allows users to test their custom indicators and strategies using real-time data. Users can use strategy tester to simulate the execution and outcome of their indicators and strategies in live market conditions. Users can also monitor the results and statistics of their indicators and strategies.

Investing.com’s Charting and Technical Analysis Tools

tradingview vs investing.com chart
Investing.com Chart

Investing.com’s charting and technical analysis tools have the following features:

  • Live charts: Investing.com allows users to access live charts for their markets and instruments. Users can choose from various chart types such as line, candlestick, bar, area, etc. Users can also adjust the time frames from 1 minute to 1 month. Users can also zoom in and out, pan, scroll, and crosshair their charts.
  • Basic indicators: Investing.com allows users to apply and modify over 30 built-in technical indicators to their charts. Users can choose from indicators such as moving averages, oscillators, trend lines, Bollinger bands, etc. Users can also customize the parameters, colors, styles, and scales of their indicators.
  • Technical summaries: Investing.com provides users with technical summaries for their markets and instruments. Technical summaries are concise overviews of the technical analysis of the markets and instruments based on various indicators and time frames. Technical summaries also provide users with buy/sell signals based on the technical analysis.
  • Pattern recognition: Investing.com provides users with pattern recognition tools for their markets and instruments. Pattern recognition tools are automated tools that identify and highlight various chart patterns such as triangles, wedges, flags, etc. Pattern recognition tools also provide users with potential price targets based on the chart patterns.

Data Coverage and Market Insights

TradingView’s Data Coverage and Market Insights

TradingView’s data coverage and market insights have the following features:

  • Real-time data from multiple sources: TradingView provides users with real-time data from multiple sources such as exchanges, brokers, data providers, etc. Users can access real-time data for various markets such as stocks, forex, crypto, commodities, indices, etc. Users can also choose the preferred data source for their markets and instruments.
  • Historical data up to 40 years: TradingView provides users with historical data up to 40 years for their markets and instruments. Users can access historical data for various time frames such as daily, weekly, monthly, etc. Users can also use historical data for backtesting and analysis purposes.
  • Global market coverage across 135+ exchanges: TradingView provides users with global market coverage across 135+ exchanges in over 65 countries. Users can access data and information from various markets such as US, UK, Japan, China, India, etc. Users can also compare and contrast different markets and instruments across different regions and countries.
  • Unique features and indicators: TradingView provides users with unique features and indicators that enhance their data coverage and market insights. Some of these features and indicators are:
    • Economic calendar: TradingView provides users with an economic calendar that shows the upcoming economic events and indicators that can affect the financial markets. Users can filter the economic calendar by country, category, importance, etc. Users can also see the expected, actual, and previous values of the economic indicators.
    • Earnings calendar: TradingView provides users with an earnings calendar that shows the upcoming earnings reports of various companies. Users can filter the earnings calendar by market, sector, industry, etc. Users can also see the expected, actual, and previous values of the earnings per share (EPS) and revenue.
    • Seasonality: TradingView provides users with a seasonality tool that shows the historical performance of various markets and instruments over different periods of time. Users can use the seasonality tool to identify patterns, trends, cycles, and anomalies in the markets and instruments.
    • Crypto screener: TradingView provides users with a crypto screener that allows them to scan and filter various cryptocurrencies based on various criteria such as price, volume, market cap, change, etc. Users can also sort and rank the cryptocurrencies based on various metrics such as performance, volatility, liquidity, etc.

Investing.com’s Data Coverage and Market Insights

Investing.com’s data coverage and market insights have the following features:

  • Real-time data from over 250 exchanges: Investing.com provides users with real-time data from over 250 exchanges around the world. Users can access real-time data for various markets such as stocks, forex, crypto, commodities, indices, futures, options, etc. Users can also see the bid/ask prices, spreads, volumes, etc. of their markets and instruments.
  • Historical data up to 20 years: Investing.com provides users with historical data up to 20 years for their markets and instruments. Users can access historical data for various time frames such as daily, weekly, monthly, etc. Users can also use historical data for analysis and comparison purposes.
  • Global market coverage across 100+ countries: Investing.com provides users with global market coverage across 100+ countries in over 30 languages. Users can access data and information from various markets such as US, UK, Japan, China, India, etc. Users can also switch between different languages and currencies according to their preferences.
  • Additional market insights or news features: Investing.com provides users with additional market insights or news features that enhance their data coverage and market insights. Some of these features are:
    • Live news and analysis: Investing.com provides users with live news and analysis from various sources such as Reuters, Bloomberg, CNBC, etc. Users can access live news and analysis for various markets and instruments. Users can also filter the news and analysis by category, importance, source, etc.
    • Sentiment indicators: Investing.com provides users with sentiment indicators that show the mood and opinion of the trading community on various markets and instruments. Users can access sentiment indicators such as bullish/bearish percentage, buy/sell signals, investing.com technical summary, etc.
    • Portfolio tools and alerts: Investing.com provides users with portfolio tools and alerts that allow them to manage their portfolio performance and get alerts on market movements and opportunities. Users can create and track multiple portfolios for their markets and instruments.

TradingView vs. Investing.com Pricing

TradingView and Investing.com have different pricing and subscription plans that provide traders with different options and capabilities for accessing their features and functionalities. They both have some pros and cons that can make them more or less suitable for certain trading needs and preferences.

TradingView’s Pricing and Subscription Plans

TradingView’s pricing and subscription plans have the following features:

  • Free plan: TradingView offers a free plan that allows users to access some of its features and functionalities for free. Users can use the free plan to access interactive charts, basic indicators, data coverage, market insights, social trading features, etc. However, the free plan has some limitations, such as ads, fewer indicators, fewer alerts, fewer data sources, etc.
  • Free Trial: New users can usually try out any of TradingView’s premium plans for free when they use our affiliate link.

TradingView Limited Time Offer!

Exclusive Deal: 30-Day FREE Premium Access + Bonus Credit

Don’t Miss Out – Sign up for TradingView Now!

  • Advanced Charts
  • Real-Time Data
  • Track all Markets
CLAIM YOUR FREE TRIAL

  • Paid plans: TradingView offers paid plans that allow users to access more of its features and functionalities for a monthly or annual fee. Users can choose from the following paid plans:
    • Essential plan: The Essential plan costs $14.95 per month or $155.40 per year. Users can use the Essential plan to access an ad-free experience, more indicators, multiple charts, more alerts, more data sources, etc.
    • Plus plan: The plus plan costs $29.95 per month or $299.40 per year. Users can use the plus plan to access all the features of the Essential plan plus more layouts, more devices, intraday renko charts, custom intervals, etc.
    • Premium plan: The Premium plan costs $59.95 per month or $599.40 per year. Users can use the premium plan to access all the features of the Plus plan plus more indicators per chart, more alerts per chart, priority customer support, etc.
  • Discounts: TradingView offers discounts for users who choose to pay annually instead of monthly. Users can save up to 16% by paying annually instead of monthly.

Investing.com’s Pricing and Subscription Plans

Investing.com’s pricing and subscription plans have the following features:

  • Free plan: Investing.com offers a free plan that allows users to access most of its features and functionalities for free. Users can use the free plan to access data coverage, market insights, charting tools, portfolio tools, alerts, social trading features, etc. However, the free plan has some limitations, such as ads, fewer portfolio tools, fewer analysis tools, fewer data sources, etc.
  • Paid plans: Investing.com offers Investing Pro plans that allow users to access more of its features and functionalities for a monthly or annual fee. Users can choose from the following paid plans:
    • Investing Pro: The Investing Pro plan costs $34.99 per month or $299.99 per year, or $479 for two years. Users can use the premium plan to access ad-free experience, advanced portfolio tools, premium analysis tools, premium data access, etc.
  • Discounts: Investing.com offers discounts for users who choose to pay annually instead of monthly. Users can save up to 42% by paying annually instead of monthly.

TradingView vs. Investing.com | Bottom Line

TradingView and Investing.com are both online platforms that provide traders with various tools and resources for trading and investing. They both have some core features and functionalities that make them popular and comprehensive platforms for traders. However, they also have some differences that make them unique and distinct from each other.

TradingView is mainly focused on providing traders with interactive charts, advanced technical analysis tools, and social trading features. However, TradingView lacks in market news and anything other than technical analysis. You can learn more in our complete TradingView tutorial.

Investing.com is mainly focused on providing traders with comprehensive data coverage, market insights, and portfolio management tools. Investing.com’s charting is good and includes several indicators, but TradingView’s interactive charts are much better for technical analysis.

Before you go

If you want to keep educating yourself about trading, you must check out these posts as well:

What is the Most Successful Options Strategy

Options Trading for Income: The Complete Guide

Mark Minervini’s Trading Strategy: 8 Key Takeaways

The Best Options Trading Books

TradingView Pricing Guide

The Best Laptops and Computers for Trading

The Best Monitors for Trading

How to Get a TradingView Free Trial

The Best TradingView Indicators

Trendspider vs. TradingView

TrendSpider Free Trial

TrendSpider Discount Code

TC2000 Free Trial – Can You Use TC2000 for Free?

tc2000 free trial image with indicators enabled

TC2000 is a popular charting platform for stocks, but to access all of its features, there is a subscription fee. Continue reading to learn if you can get a TC2000 free trial, what features a free account allows you to access, and how TC2000 compares to the competition. 

Can You Get a TC2000 Free Trial?

TC2000 offers a downloadable desktop app plus a web-based trading platform, which you can use for free when you create an account. However, there is no TC2000 free trial for its premium features. 

If you are interested in using the premium features of TC2000, you can use my TC2000 discounted link to save $25 on your subscription, which will give you essentially 1-3 months free, depending on which plan you pick. 

TC2000 Free vs. Paid Account Differences

While many TC2000 features require a paid subscription, you can still use the free version to test it out. Here is a breakdown of what you can do on a free TC2000 account:

TC2000 Free Account Features

  • Create personal watchlists
  • Use various indicators like the RSI, Ichimoku, volume at price, and more
  • Chart most stocks with delayed data
  • Use all timeframes down to the 1-minute (with delayed data)

tc2000 free trial image with indicators enabled
Free TC2000 Account With RSI, Volume at Price, and Ichimoku Indicators Enabled

TC2000 Paid Account Features

  • Access real-time data
  • Set alerts
  • Access the TC2000 library
  • View TC2000’s notes and news feature
  • Place trades

TC2000 Web Platform vs. Desktop Platform

There are not many differences between the TC2000 web platform and the desktop platform. The only main difference I noticed when testing them is that the desktop platform runs much smoother. 

The web-based platform is a great option if you are using a public or work device, but if you can, I’d recommend downloading the desktop platform. Free accounts can use either platform as well, so even if you are just testing the free TC2000 version, I would recommend the desktop platform for performance reasons. 

What Assets Can You Chart on TC2000?

TC2000 allows you to chart stocks, ETFs, and options. Therefore, you should consider other platforms like TradingView if you want to track crypto, futures, and forex as well. 

TC2000 vs. the Competition

While TC2000 is a great charting platform, there are many other options available, such as TradingView, TrendSpider, Trade Ideas, and many more. All of these platforms have unique strengths and weaknesses, but overall, I would say TradingView is the best charting software for stocks. 

TradingView offers nearly real-time data for most assets for free and allows you to chart all markets, including stocks, futures, crypto, forex, and more, from a single platform. You can check out my comparison articles of these platforms below:

Trade Ideas Free Trial – Can You Use Trade Ideas for Free?

trade ideas coupon code

Does Trade Ideas Have a Free Trial?

While it is completely free to sign up for a Trade Ideas account, the free version will only give you access to 15-minute delayed data. There is no Trade Ideas free trial that gives you access to all of the features with real-time data since the exchanges charge to provide the data. 

However, Trade Ideas occasionally offers events called Test-Drives which allow you to access all of the features for a small cost. If you want to be notified when these events go live, I recommend you sign up for a Trade Ideas account using my discounted link. When you use my special discounted link, you will get a 15% discount on your premium subscription if you decide to upgrade.  

trade ideas coupon code

How Much Does Trade Ideas Cost?

Trade Ideas has a couple of plans that range from $89-$179 per month. There is also a free version, which you can access by simply signing up for an account. Here is a breakdown of the Trade Ideas plans:

  • TI Basic: Access real-time data, 10 charts per screen, and multi-monitor layouts
  • Premium Alpha Pro: Access real-time data, 20 charts per screen, and auto-trading capabilities
  • Free: Access 15-minute delayed data, 1 chart per screen, and web dashboards

Read my full review of Trade Ideas for a more in-depth analysis of the platform.

Trade Ideas Features

Trade Ideas is an AI-powered stock analysis platform and screener with tons of useful features to help you spot the best trades. Here is a breakdown of some of the most popular features:

  • Charting & AI Stock Scanner: Utilize cutting-edge AI scanners to accurately monitor the most active stocks for effective trading.
  • Flexible Platform: Choose between web-based or downloadable desktop platform options to suit your preferences.
  • Real-Time Data: Access real-time data as part of your subscription, with no additional costs.
  • Advanced Charting Capabilities: Utilize various indicators and drawing tools with up to 20 charts per screen to monitor the markets.

Trade Ideas Free Trial – Bottom Line

While Trade Ideas doesn’t offer free trials due to exchange data restrictions, you can sign up for a free account to test it out with delayed data for free. You can also sign up using my 15% Trade Ideas discounted link to ensure you get the best price if you decide to upgrade. 

If you are an active day trader, I recommend trying out various trading platforms like TradingView, TrendSpider, and Trade Ideas, so you can decide which is best for your trading style. You can read more about these platforms in my detailed articles below:

Barchart vs. StockCharts | Exploring Charting Platforms

barchart chart

Barchart and StockCharts offer a range of features catering to different types of traders and investors.

Let’s dive in to understand each platform’s unique strengths and how they stack up against each other. You can also check out my article on the best charting software, which includes both Barchart and StockCharts,

Barchart: Real-time Data and Trading Education

Barchart is a comprehensive platform known for its real-time market data and robust trading education resources. Its features include customizable chart indicators and technical analysis tools, making it ideal for users who need to track and analyze stocks, commodities, and mutual funds in real-time.

Barchart Pricing

Barchart has a couple of plans you can choose from, starting at $89 per month.

barchart pricing table

For more insights into Barchart’s offerings and a comparison with another popular platform, check out our Barchart vs. TradingView article.

StockCharts: Technical Analysis and Screening Capabilities

StockCharts shines with its powerful technical analysis features and screening tools. It allows users to analyze historical price data, identify patterns, and make informed investment decisions.

StockCharts Pricing

StockCharts pricing ranges from $14.95 to $39.95 per month, depending on which plan you choose.

stockcharts pricing table

If you’re interested in how StockCharts compares with other platforms, our TradingView vs. StockCharts comparison provides a deeper look.

Comparing Barchart vs. StockCharts: Key Differences

While both Barchart and StockCharts offer valuable services, they cater to different user needs:

  • Real-time Market Data: Barchart excels in providing real-time market data, making it a go-to platform for active traders.
  • Trading Education: Barchart also offers resources for users looking to expand their trading knowledge.
  • Technical Analysis: StockCharts stands out for its technical analysis capabilities, ideal for investors who rely on historical price data analysis.
  • Screening Tools: StockCharts also offers screening tools to filter stocks based on specific criteria.

To understand the importance of good indicators in trading platforms, our Best TradingView Indicators article provides useful insights.

Barchart vs. StockCharts in the Broader Landscape

When compared to other platforms like TradingView and thinkorswim, both Barchart and StockCharts hold their ground with unique strengths. For a more detailed understanding of volume profiles in charting platforms, our TradingView Volume Profile article is a must-read.

Frequently Asked Questions

Who should use Barchart?

  • Barchart is well-suited for traders who require real-time market data and access to trading education resources.

Who should use StockCharts?

  • StockCharts is a preferred platform for investors who focus on technical analysis and screening capabilities.

Can I access historical price data on both platforms?

  • Yes, both Barchart and StockCharts allow access to historical price data, with StockCharts providing more advanced analysis tools.

Do Barchart and StockCharts provide educational resources?

  • Yes, both platforms provide educational resources, with Barchart being particularly known for its trading education resources.

Charting Your Financial Journey

In summary, choosing between Barchart and StockCharts depends on your individual trading or investment strategy.

Both platforms have their unique strengths and cater to different user needs. As always, we recommend exploring both platforms to determine the one that aligns best with your financial goals.