Morning Star Pattern: A Bullish Reversal Signal

Morning Star Pattern

Candlestick patterns are powerful tools used by traders and investors in technical analysis. One such pattern that often grabs the attention of market participants is the morning star pattern—a notable bullish reversal pattern that signals a potential bottom in a downtrend.

In this article, we’ll explore the characteristics of the morning star pattern, its reliability, the psychology behind its formation, and how you can analyze it using TradingView.

Morning Star Pattern
Morning Star Pattern on TradingView

Understanding the Morning Star Candlestick Pattern

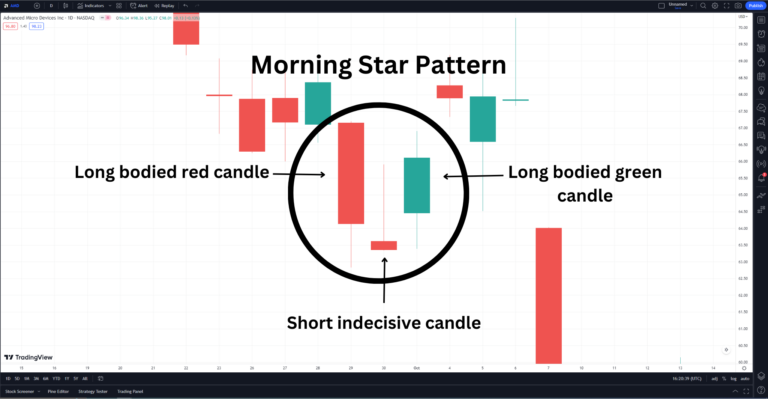
The morning star pattern is a three-candle formation that typically occurs at the end of a downtrend:

  1. The first candle is a long-bodied bearish (red or black) candle that indicates the bears’ control and extends the current downtrend.
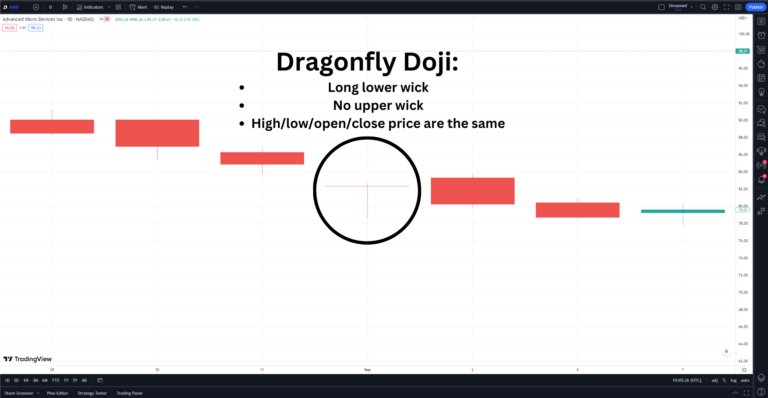
  2. The second candle is a short indecisive candle, often a doji or spinning top, that signals market indecision. It may gap down from the first candle.
  3. The third candle is a long-bodied bullish (green or white) candle that signals a reversal in the trend. It often gaps up from the second candle and closes above the midpoint of the body of the first candle.

Bullish or Bearish: Nature of the Morning Star Pattern

The morning star pattern is a bullish reversal pattern that indicates a potential shift from a bearish trend to a bullish trend. In contrast, the evening star pattern is its bearish counterpart, signaling a reversal from an uptrend to a downtrend.

Reliability of the Morning Star Candlestick Pattern

While the morning star pattern is seen as a reliable indicator of a trend reversal, traders should be cautious as no pattern guarantees a certain outcome. Factors that can enhance the reliability of the pattern include:

  • Confirmation with other technical indicators
  • Increased volume on the third candlestick
  • Occurrence after a well-defined downtrend

Psychological Behavior Behind the Pattern

The formation of the morning star pattern reflects changing market sentiment:

  • On the first day, the bears dominate, pushing the price lower and forming a long bearish candle.
  • On the second day, uncertainty arises as neither the bears nor the bulls take control, resulting in a short indecisive candle.
  • On the third day, renewed buying interest from the bulls leads to a gap up opening and a long bullish candle, confirming the bullish reversal.

Trading with the Morning Star Pattern

Traders can use the morning star pattern as a potential buy signal. However, it’s essential to confirm the pattern with other technical indicators and assess the overall market conditions before making trading decisions.

Analyzing Patterns with TradingView

TradingView is a popular platform for technical analysis that offers a wide range of features for analyzing candlestick patterns. Users can access advanced charting tools and customize their analysis to suit their trading style.

Plus, TradingView is offering a 30-day free trial and a discount on your subscription when you use my link, so you can get started with your technical analysis journey today!

tradingview banner

Morning Star Pattern | Bottom Line

The morning star pattern is a valuable tool for identifying potential bullish reversals in the market. By understanding its characteristics, reliability, and the psychology behind its formation, traders can make more informed decisions.

Remember, successful trading involves careful analysis and a well-rounded approach, so consider the morning star pattern as part of your trading toolkit.

This article contains affiliate links I may be compensated for if you click them.

TradingView Free Trial Guide 2024

tradingviewfreetrialblog

TradingView is one of the best platforms providing charts currently available on the internet. Although you can still use it with absolutely zero issues for free, TradingView offers multiple subscription plans with countless different tools.

Does TradingView Have a Free Trial?

Yes, Tradingview offers free trials for its upgraded plans (Essential, Plus, and Premium). When you use my link, you will also get a discount on your subscription if you decide to continue after 30 days.

Tradingview usually offers free trials for its new platform users, although this is subject to change. The best way to find out if TradingView is currently offering free trials is to follow the instructions below or simply look at their website.

TradingView Limited Time Offer!

Exclusive Deal: 30-Day FREE Premium Access + Bonus Credit

Don’t Miss Out – Sign up for TradingView Now!

  • Advanced Charts
  • Real-Time Data
  • Track all Markets
CLAIM YOUR FREE TRIAL

How to Get a TradingView Free Trial

Trials aren’t accessible with existing plans or by users that are currently logged into an existing account.

If you want to create a new account, it’s important to note that TradingView has a strict policy around registering multiple accounts.

Therefore, if you already have an existing account, consider deleting it along with any old accounts.

Trialing the Essential, Plus, or Premium is hands down the best way to figure out what those features provide and which is best suited for you.

A free trial allows you to make a more informed decision before subscribing.

Also, if one particular plan suits you perfectly, I highly recommend taking the ‘Annual’ subscription option and taking advantage of discounts offered to annual subscribers.

Here are step-by-step instructions to get access to a TradingView free trial:

1. If you are a NEW TradingView user, skip to Step 2. If you already have a TradingView account. Make sure you’re signed out, and refer to the section above regarding multiple Accounts.

2. Go to the TradingView plans and upgrade page and see whether TradingView is currently offering trials. New users should be offered a free 30 days trial period for the Essential, Plus, or Premium plans.

3. Select the ‘Try free for 30 days’ subscription of your choice. You’ll need to select the Essential, Plus, or Premium plan to trial at this stage.

4. Signup with a NEW email

5. Complete the credit card or PayPal details (required for the free trial period). Take note of the auto-renewal date and trial hold amount.

6. Click ‘Start 30-day free trial, and that’s it! You may have to wait a few seconds but you will be directed to a TradingView chart.

7. You’re all set! Your free trial has started. You should now have access to all the features of your selected plan. Don’t forget to take note of the trial expiration date.

FAQs

Q: Does TradingView offer a free trial?

  • A: Yes, TradingView provides a free trial for its upgraded plans, including Essential, Plus, and Premium. This trial allows users to explore and experience the additional features and functionalities offered by these plans.

Q: How long is the free trial period?

  • A: The free trial period for TradingView’s upgraded plans is typically 30 days. During this time, users can access and utilize the advanced tools and features to enhance their trading and investing activities.

Q: Can I access all the features during the free trial?

  • A: Yes, during the free trial period, you will have full access to all the features and functionalities offered by the plan you choose. This allows you to explore and evaluate the upgraded plan thoroughly before making a decision.

Q: How can I start the free trial?

  • A: To start the free trial, you can visit the TradingView website and sign up for a free account. Once you have created your account, you can choose the plan you want to trial, and the free trial will be activated for the selected plan.

Q: Can I cancel my free trial before it ends?

  • A: Yes, you can cancel your free trial at any time before it expires. If you decide that the upgraded plan is not suitable for your needs, you can cancel the trial to avoid any future charges. However, it’s important to note that once the trial period ends and you choose to continue with the subscription, normal billing will apply.

Q: Are there any discounts available for TradingView’s upgraded plans?

  • A: TradingView occasionally offers discounts and promotions for its upgraded plans. You can use my link to get a discount on your membership as well.

Q: Can I switch plans during the free trial period?

  • A: Yes, you have the flexibility to switch between different plans during the free trial period. If you find that your initial choice of plan doesn’t meet your requirements, you can explore other plans and switch to the one that better aligns with your trading and investing needs.

Q: Is the TradingView free trial available worldwide?

  • A: Yes, the TradingView free trial is available to users worldwide. You can access the trial regardless of your location as long as you have an internet connection and meet the eligibility criteria.

How to See Implied Volatility (IV) Rank on thinkorswim

thinkorswimivrank

Discover the difference between IV rank and IV percentile and how you can add IV rank to the thinkorswim platform.

What are Implied Volatility and Historical Volatility

Before we get into implied volatility rank (IVR), we must understand implied volatility (IV) and historical volatility (HV). HV is also known as realized volatility.

The implied volatility of an underlying stock is a measure of the market’s expectation of future price movement. Implied volatility is a component of the Black-Scholes model used to determine option prices.

A stock with high implied volatility is expected to move a lot and have high option premiums and vice versa.

Historical volatility measures how far a stock’s price moves away from its average. Essentially, the higher the realized volatility of a stock, the riskier it is.

What is Implied Volatility Rank (IVR)

IVR is a measurement used by options traders to determine how the current implied volatility of a stock compared to the last 52 weeks. IVR is measured on a scale of 0-100. 0 is the lowest IV in the past year, and 100 is the highest in the past year.

Option traders utilize IVR to determine if implied volatility is high or low compared to what it usually trades at. Generally, you should sell options with high IV to take advantage of the elevated premiums.

What is IV Percentile (IVP)

IVP is a similar metric to IVR, except it measures the percentage of days over the last 52 weeks that implied volatility was lower than its current level. For example, if the IVP of a stock is at 25%, that means 75% of the time over the last year, IV was higher.

IV Rank vs. IV Percentile

Both IVR and IVP are valuable metrics for options traders to use. The difference is that IVP measures a percentage of days, while IVR measures IV itself.

How to Calculate IV Rank

To determine the IV rank of a stock, you must figure out the range implied volatility traded between the last 52 weeks. For example, let’s say that a stock’s IV traded between 20% and 40% over the previous 52 weeks.

If the current implied volatility is 30%, the stock’s IV rank is 50.

How to Add Implied Volatility Rank to thinkorswim

If you use thinkorswim to trade options, you may realize there is no default indicator for IV rank. However, thinkorswim does have IV percentile by default, which is similar, but not exactly the same as explained above.

Luckily, you can add a tastytrade IV rank custom indicator to thinkorswim by using the code at the bottom of this article. Even with this custom IV rank indicator, the exact readings on thinkorswim and the tastytrade brokerages do not match.

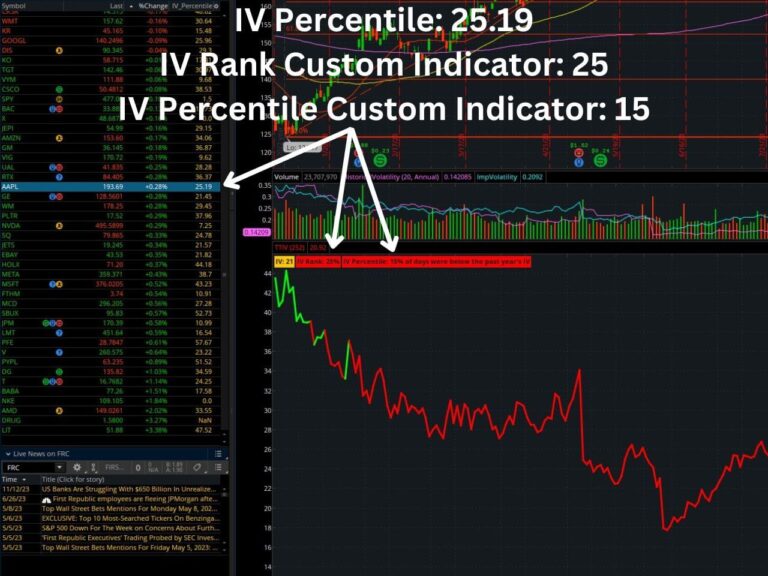
Let’s take a look at the IV rank and IV percentile of AAPL stock on both platforms so we can effectively compare and contrast. Here are the IV rank and IV percentile readings of AAPL stock at the same time on both platforms:

thinkorswimivrank
IV rank and percentile on thinkorswim
  • AAPL stock thinkorswim IV percentile default – 25.19%
  • AAPL stock thinkorswim IV rank custom tastytrade indicator – 25%
  • AAPL stock thinkorswim IV percentile custom tastytrade indicator – 15%

As you can see from the image and numbers from thinkorswim above, the default IV percentile option essentially matches the reading of the custom tastytrade indicator. Therefore, adding it isn’t of much benefit unless you want to see it plotted on a chart. 

tastytradeivrank
IV rank on the tastytrade platform 
  • AAPL stock tastytrade IV rank – 9.1%
  • AAPL stock tastytrade IV percentile – 11.6%

As you can see from the tastytrade image and IV readings above, the IV rank and IV percentile are quite different from the readings from thinkorswim. In fact, none of them match, which tells us that stressing over these exact IV numbers is pointless. 

Instead of worrying about the differences, simply stick to one platform or the other, so that you are not comparing apples to oranges when comparing the IV of different stocks. 

The Custom tastytrade Indicator for thinkorswim

In the thinkorswim image above, you may notice that I am utilizing a custom indicator called TTIV (tastytrade IV). The indicator displays both an IV percentile and IV rank calculation.

I have concluded that the IV readings between thinkorswim and tastytrade do not match and are not worth deciphering. However, if you want access to the custom indicator to add to thinkorswim, I will leave the code and instructions at the bottom of this post.

My advice is to pick one method of tracking the IV rank or IV percentile and stick with it so it is the same for all of your trades.

Otherwise, you can plot the normal implied volatility indicator (not rank or percentile) on your chart and determine whether you believe the implied volatility is elevated or low.

How to Add the tastytrade Custom Indicator to thinkorswim

To add the tastytrade (TTIV) custom indicator to your thinkorswim charts, follow these steps:

  • Chart tab -> studies (beaker) -> create -> enter name (TTIV) -> delete the default code and paste in the code at the bottom of this article.
thinkorswimaddstudy
Adding a custom study to thinkorswim

How to Scan for Implied Volatility Rank in thinkorswim

thinkorswim has a built-in stock scanner that allows you to discover stocks with high IV rank/IV percentile. To utilize it, follow these steps:

  • Scan tab -> add filter -> volatility -> IV_percentile
ivscannertos
IV scanner on thinkorswim

Once you add this study, you can scan for stocks that have a specific range of IVR/IVP.

Implied Volatility Rank on TradingView

If you prefer to use TradingView charts, there are custom IV rank and IV percentile indicators available for TradingView. You can learn how to add it by checking out our article on how to add IV rank and IV percentile to TradingView.

However, if you want to take full advantage of the features TradingView has to offer, you can sign up for a free trial for a premium subscription using my affiliate link. You will also get a credit toward your subscription.

tradingview banner

# ————————START BELOW THIS LINE————————–

#

# tastytrade/dough Research Team

# Michael Rechenthin, Ph.D.

# Follow me on twitter: @mrechenthin

#

# IV Rank is a description of where the current IV lies in comparison

# to its yearly high and low IV

#

# IV Percentile gives the percentage of days over the last year, that

# were below the current IV. If the IV Rank is above 50%, then

# the script will highlight it green; otherwise red.

#

# For information on the two, see Skinny on Options Data Science,

# titled “IV Rank and IV Percentile (w/ thinkscript)” on Nov 12, 2015

# http://ontt.tv/1Nt4fcS

#

# version 3.2

#

declare lower;

declare hide_on_intraday; # do not display when using intra-day plots

input days_back = 252; # it is most common to use 1-year (or 252 trading days)

def x;

if GetAggregationPeriod() > AggregationPeriod.DAY {

x=1;

} else {

x=2;

}

AddLabel(yes, if (x==1) then “This script should be used on daily charts only” else “”);

# implied volatility

# using proxies for futures

def df = if (GetSymbol() == “/ES”) then close(“VIX”) / 100

else if (GetSymbol() == “/CL”) then close(“OIV”) / 100

else if (GetSymbol() == “/GC”) then close(“GVX”) / 100

else if (GetSymbol() == “/SI”) then close(“VXSLV”) / 100

else if (GetSymbol() == “/NQ”) then close(“VXN”) / 100

else if (GetSymbol() == “/TF”) then close(“RVX”) / 100

else if (GetSymbol() == “/YM”) then close(“VXD”) / 100

else if (GetSymbol() == “/6E”) then close(“EVZ”) / 100

else if (GetSymbol() == “/6J”) then close(“JYVIX”) / 100

else if (GetSymbol() == “/6B”) then close(“BPVIX”) / 100

else if (GetSymbol() == “/ZN”) then close(“TYVIX”) / 100

else if (Getsymbol() == “/ZW”) then close(“WIV”) / 100

else if (Getsymbol() == “/ZB”) then imp_volatility(“TLT”)

else if (Getsymbol() == “/ZC”) then imp_volatility(“CORN”)

else if (Getsymbol() == “/ZS”) then imp_volatility(“SOYB”)

else if (Getsymbol() == “/KC”) then imp_volatility(“JO”)

else if (Getsymbol() == “/NG”) then imp_volatility(“UNG”)

else if (Getsymbol() == “/6S”) then imp_volatility(“FXF”)

else imp_volatility();

def df1 = if !IsNaN(df) then df else df[-1];

# display regular implied volatility

# —————————

AddLabel(yes, “IV: ” + Round(df1 * 100.0, 0), Color.ORANGE);

# calculate the IV rank

# —————————

# calculate the IV rank

def low_over_timespan = Lowest(df1, days_back);

def high_over_timespan = Highest(df1, days_back);

def iv_rank = Round( (df1 – low_over_timespan) / (high_over_timespan – low_over_timespan) * 100.0, 0);

AddLabel(yes, “IV Rank: ” + iv_rank + “%”, if iv_rank > 50 then Color.GREEN else Color.RED);

# calculate the IV percentile

# —————————

# how many times over the past year, has IV been below the current IV

def counts_below = fold i = 1 to days_back + 1 with count = 0

do

if df1[0] > df1[i] then

count + 1

else

count;

def iv_percentile = Round(counts_below / days_back * 100.0, 0);

plot IVs = df1 * 100;

IVs.SetLineWeight(3);

IVs.AssignValueColor(if iv_rank > 50 then Color.GREEN else Color.RED);

AddLabel(yes, “IV Percentile: ” + iv_percentile + “% of days were below the past year’s IV”, if iv_percentile > 50 then Color.GREEN else Color.RED);

# thanks to Kevin Osborn for the following line

AddLabel(yes, if (GetSymbol() == “/6S” or GetSymbol() == “/ZB” or GetSymbol() == “/ZC” or GetSymbol() == “/NG” or GetSymbol() == “/ZS” or GetSymbol() == “/KC”) then “* ETF based” else “”, Color.BLACK);

# ————————END ABOVE THIS LINE————————

Mark Minervini’s Trading Strategy: 8 Key Takeaways

markminervini

Stock market wizard Mark Minervini’s trading strategy won him the U.S. investing championship.

Mark Minervini’s Trading Strategy

Mark Minervini is known for trading fast-moving growth stocks while implementing a concrete entry and exit strategy. Minervini believes that timing your trades is critical and recommends you combine technical analysis, fundamental analysis, and risk management.

Mark Minervini is famous for trading the volatility contraction pattern (VCP). The VCP pattern was popularized by the famous traders Jesse Livermore, William J. O’Neil, and Richard D. Wyckoff. He is also known as one of the stock market wizards mentioned in Jack Schwager’s book Market Wizards: Interview With Top Traders.

Mark Minervini’s trading strategy allowed him to win multiple U.S. investing championships. In 1997, Minervini put up $250,000 of his own money and generated a 255% annual return winning the U.S. Investing Championship. He entered again in 2021, this time in the $1,000,000 category, and won with an audited 334.8% annual return.

markminervini

What is the Volatility Contraction Pattern (VCP)?

The overall premise behind the VCP is that stocks in long-term trends will eventually consolidate as investors take profit and more stock is accumulated by buyers. This pattern applies across any time frame, even for day traders, so it is worth learning regardless of your trading style.

However, Minervini warns against mixing up different styles of trading. Instead, he recommends that you pick one type and become a specialist in it. For example, some traders prefer day trading, while others prefer swing trading.

A Real Trade Mark Minervini Took

On January 4, 2022, Minervini tweeted that he bought the ticker symbol $XLE the day before. After he purchased, the ETF surged in price, rallying over 70% when it reached its peak. Minervini based this trade on technical and fundamental reasons, so let’s analyze what Minervini saw.

mark minervini tweet

$XLE’s technical setup

In the weekly chart below, I have circled where Minervini entered the trade. $XLE is a perfect example of a VCP because the ETF was trending up, making higher lows, and breaking out of a consolidation phase.

The trend is confirmed by the green cloud formed on the Ichimoku indicator on the chart below. Minervini probably could have waited for $XLE to break out of this consolidation completely, but if the trend reversed, he would stop out anyway.

If you want to begin charting like a pro, new users can usually grab a TradingView free trial to get access to one of the best charting tools available.

xle chart tradingview
A weekly chart of the ETF $XLE on Tradingview.

TradingView Limited Time Offer!

Exclusive Deal: 30-Day FREE Premium Access + Bonus Credit

Don’t Miss Out – Sign up for TradingView Now!

  • Advanced Charts
  • Real-Time Data
  • Track all Markets
CLAIM YOUR FREE TRIAL

$XLE’s fundamental reasoning

The ETF $XLE follows companies in the energy and oil sector. At the beginning of 2022, there were talks about Russia invading Ukraine and inflation concerns. Both of these fundamental reasons are bullish for the energy sector.

Minervini took this information, combined it with the technical setup on the chart, and decided that $XLE and energy companies were a great opportunity. He was right since the stock has continued up after he bought. At this point, he can set a stop loss in profit and let the trade ride.

Mark Minervini’s Trading Strategy Key Takeaways

1- Manage your risk

Mark Minervini always recommends cutting your losses quickly and respecting your stop loss. Before you get into a trade, you should know when you will bail out if the trade goes south.

2- Never average down

If a trade is going against you, Minervini does not recommend that you try to salvage it. Instead, Minervini suggests that you average into trades when they move up and use a stop loss when the trade goes against you.

3- Lock in profits

According to Minervini, one of the worst things you can do as a trader is let a significant profit turn into a small loss. When you have a position in profit, you must watch it closely and take profit as soon as possible.

4- Protect your breakeven point

Minervini is a fan of protecting your breakeven with stop losses. Ideally, you own a stock that rises in value and set a stop loss above your entry price, locking in a guaranteed profit.

5- Don’t try to buy the bottom

Mark Minervini bases his trades on technical analysis, but this doesn’t mean he is attempting to buy the exact bottom. Minervini instead waits for stocks to be in confirmed uptrends before buying.

6- Concentrate your portfolio

To generate outstanding returns, you must concentrate on the best trades available on the market. Minervini does not believe in diversification because it keeps you focused on your position.

7- Time your trades

While many investors preach to buy and hold, Minervini believes entering trades at the right time is crucial. When a technical setup and fundamentals look amazing, it is the right time to enter.

8- Only trade the best names

Since Minervini recommends you concentrate your account, you should only be trading leading names. Leading names are the most likely to continue their uptrend, especially if they are solid fundamentally.

Bottom Line

Mark Minervini is a trader with audited returns and has proven his success. Regardless of your trading skill level, you can learn a thing or two from Minervini’s process. If you want to start learning from Mark Minervini, he has a service called Minervini Private Access that you can join.

Similar to Mark Minervini’s group, joining the HaiKhuu Trading Community gives you access to thousands of experienced traders willing to help you learn and become more profitable on the stock market!

Mark Miniervini’s Books

If you want to learn more about Mark Minervini’s trading strategy, you should read his books. The books cover his strategy in-depth and explain how he used the VCP to win multiple U.S. investing championships.

Trade Like a Stock Market Wizard: How to Achieve Super Performance in Stocks in Any Market

Think & Trade Like a Champion: The Secrets, Rules & Blunt Truths of a Stock Market Wizard

Momentum Masters: A Roundtable Interview with Super Traders with Minervini, Ryan, Zanger & Ritchie II

Mindset Secrets for Winning: How to Bring Personal Power to Everything You Do

Mark Minervini’s Net Worth

  • As of 2024, Mark Minervini’s net worth is estimated to be $30 million.
  • Mark Minervini’s annual salary is estimated to be about $3 million.

FAQs

What is Mark Minervini’s trading strategy?

  • A: Mark Minervini is known for his trading strategy focused on fast-moving growth stocks. His approach involves implementing a concrete entry and exit strategy, along with advanced technical analysis techniques like the VCP. Minervini emphasizes the importance of cutting losses quickly and letting winners run, aiming to capture significant price moves in selected stocks.

What type of trader is Mark Minervini?

  • Mark Minervini is a renowned trader who primarily focuses on swing trading. Swing traders aim to capture short to medium-term price swings in stocks or other financial instruments. Minervini’s trading style combines fundamental and technical analysis to identify stocks with high growth potential and favorable chart patterns.

Is Mark Minervini a swing trader?

  • Yes, Mark Minervini is considered a swing trader. He seeks to capitalize on short-term price movements by identifying stocks that exhibit strong upward momentum. Minervini’s trading approach involves holding positions for days to weeks, aiming to capture significant gains during favorable market conditions.

What is the most profitable stock trading strategy?

  • It’s important to note that the profitability of a stock trading strategy can vary depending on market conditions and individual trader preferences. While Mark Minervini’s strategy has been successful for him, there is no one-size-fits-all approach. Traders should develop strategies that align with their risk tolerance, trading style, and market expertise.

What are some key takeaways from Mark Minervini’s trading strategy?

  • Some key takeaways from Mark Minervini’s trading strategy include:
    • Emphasizing the importance of risk management and cutting losses quickly.
    • Focusing on stocks with strong earnings growth potential and positive price momentum.
    • Utilizing technical analysis techniques to identify favorable chart patterns and entry/exit points.
    • Incorporating a systematic approach to trade selection and position sizing.
    • Continuously learning and adapting to changing market conditions.

Before you go

If you want to keep educating yourself about personal finance, you must check out these posts as well:

What is the Most Successful Options Strategy

Options Trading for Income: The Complete Guide

The Best Options Trading Books

TradingView Pricing Guide

The Best Laptops and Computers for Trading

How to Get a TradingView Free Trial

The Best TradingView Indicators

The Best Keyboards For Trading

Trendspider vs. TradingView

TrendSpider Free Trial

TrendSpider Discount Code