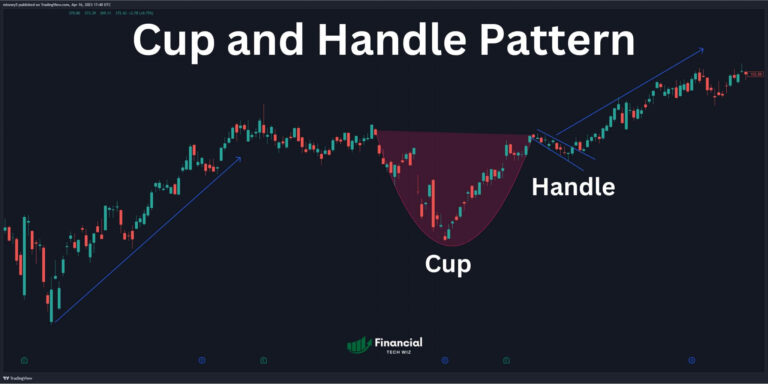
volatility contraction pattern

Volatility Contraction Pattern: VCP Trading Mastery

The Volatility Contraction Pattern (VCP) is a powerful trading pattern that has gained popularity and recognition among traders around the globe. This pattern, with its high success rate and low-risk nature, presents a unique opportunity for traders to capitalize on explosive price movements. In this article, we’ll explore the origins of the VCP and shed…

bear trap stock pattern chart

Bear Trap Stock Pattern: A Comprehensive Guide for Traders

The financial market is dynamic and ever-changing, where traders and investors continuously seek opportunities to maximize profits. In this pursuit, market participants must be aware of certain technical patterns that could lead to unexpected outcomes. One such pattern is the bear trap—an event that can catch even seasoned traders off guard. In this guide, we’ll…

evening doji star

Evening Doji Star Pattern: Decoding the Reversal Pattern

Introduction to the Evening Star Pattern Candlestick patterns are a powerful tool in the world of technical analysis, providing traders with valuable insights into potential price movements. Among these patterns, the Evening Doji Star stands out as a strong bearish reversal pattern that technical analysts often rely on to predict potential downtrends. In this article,…

gravestone doji

Gravestone Doji: Understanding the Bearish Reversal Signal

Candlestick patterns play a pivotal role in technical analysis, helping traders identify potential price trends and make informed trading decisions. One such pattern that garners the attention of traders is the gravestone doji. This article will explore the characteristics, interpretation, and practical application of this important bearish reversal signal. Understanding the Gravestone Doji The gravestone…

dragonfly doji

Understanding the Dragonfly Doji Candlestick Pattern

Dragonfly Doji Introduction Candlestick patterns are powerful tools used by traders and investors to analyze price movements and make informed trading decisions. Among the various candlestick patterns, one that stands out for its unique appearance and potential significance is the dragonfly doji. This article will explore the characteristics, interpretation, and practical use of this intriguing…

dragonfly doji

Doji Candle Types: Dragonfly, Gravestone & More

The Doji candlestick pattern is an essential technical analysis tool traders and investors often use to understand market sentiment. This article explores the meanings, types, and trading implications of the Doji pattern. Understanding the Doji Candlestick Pattern The Doji candlestick pattern is characterized by its distinct “cross” shape, where the opening and closing prices of…

tradingview footprint chart
|

How to Use Footprint Charts on TradingView

Footprint charts aren’t commonly offered on popular trading platforms, but TradingView now offers the ability to access them as a native feature. Footprint charts allow you to visualize buying and selling volume data for every candle, which pairs great with the new TradingView market profile. Continue reading to learn how to use the volume footprint…

tradingviewvolumeprofilefeatured
|

TradingView Volume Profile: A Comprehensive Guide for Traders

Intro to the Volume Profile on TradingView The volume profile is an advanced charting study that shows the amount of trading volume at specific price levels. It is a great way to find support and resistance levels, but you must know how to use the proper time frames and types of profiles to apply them…

tradingview vwap indicator
|

VWAP on TradingView: Mastering Volume Weighted Average Price

The Volume Weighted Average Price (VWAP) is a powerful technical indicator intraday traders use to make informed decisions. VWAP measures the average price of an asset, weighted by its trading volume. As a popular charting platform, TradingView provides traders with easy access to the VWAP indicator. This comprehensive guide will explore how to use VWAP…