What is the Volume of a Stock? In-Depth Analysis
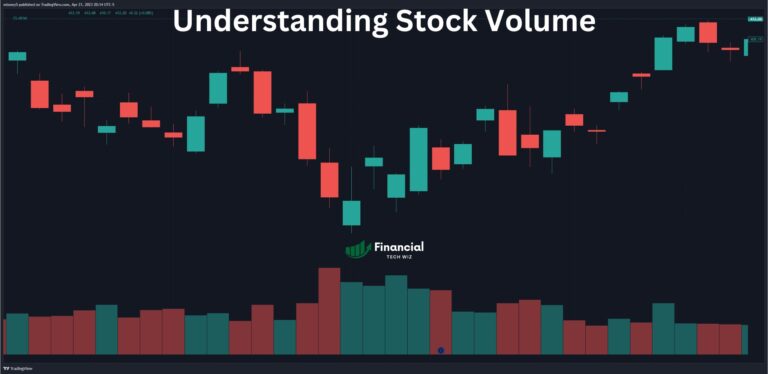
Exploring the Fundamentals of Stock Volume Stock volume is a vital metric in the world of trading and investing. It refers to the total number of shares of a particular stock that are bought and sold during a specified time frame, often measured on a daily basis. But what does this mean for traders and…