If you are looking for a growth-oriented exchange-traded fund (ETF) to invest in, you may have come across VUG and QQQ. These are two of the most popular and widely traded ETFs in the market, but they are not exactly the same.
In this article, we will compare VUG vs QQQ on various aspects, such as their holdings, performance, dividends, expenses, and risk. We will also help you decide which one may be more suitable for your investment goals and preferences.
Overview of VUG and QQQ
VUG and QQQ are both growth ETFs, which means they invest in companies that are expected to grow faster than the average market. However, they have some differences in how they select and weigh their holdings, as well as the index they track.
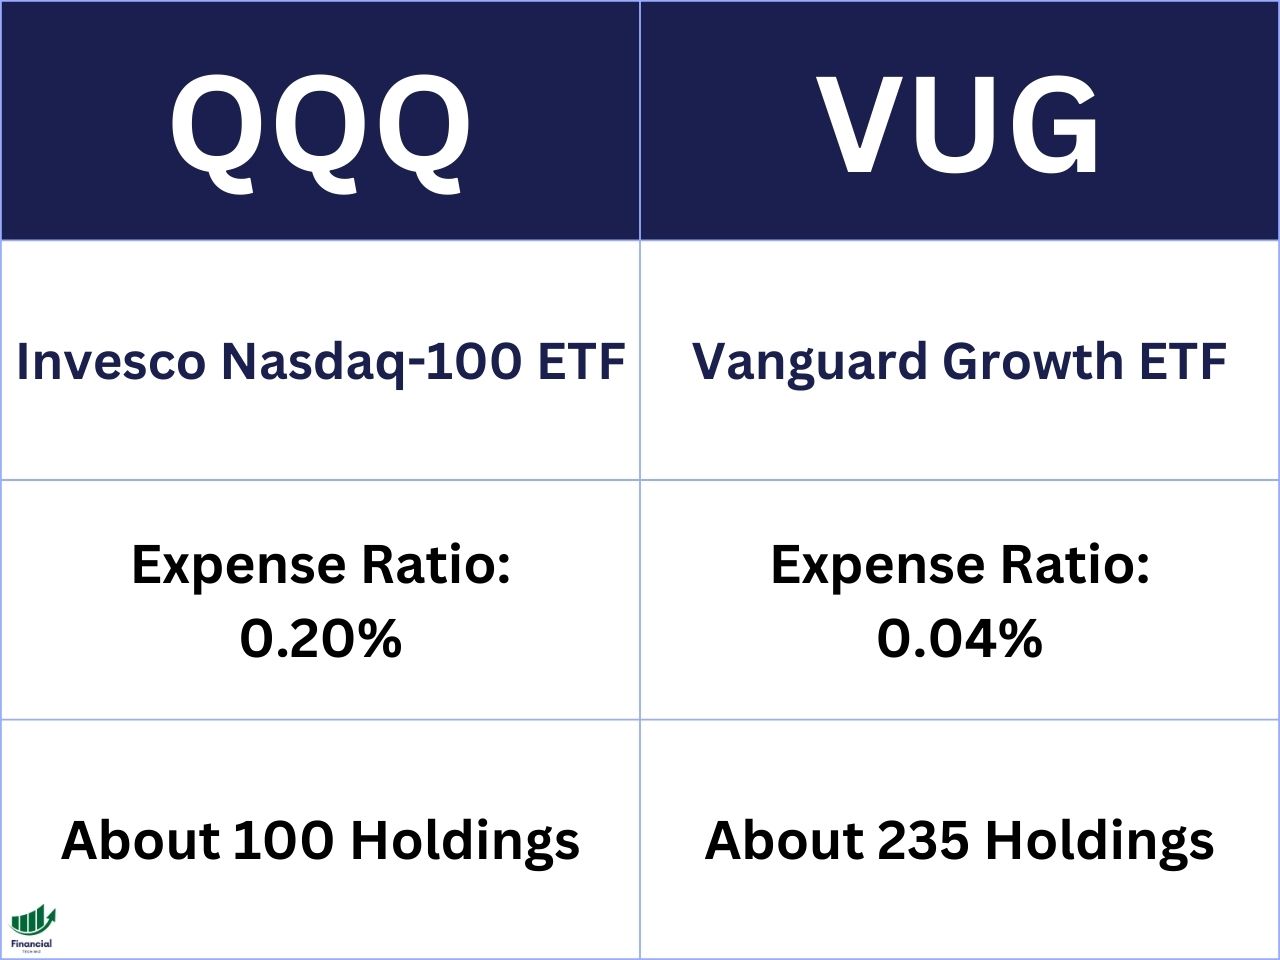
VUG is the Vanguard Growth Index Fund ETF Shares, which tracks the CRSP US Large Cap Growth Index. This index includes about 235 US companies that have a large market capitalization (over $10 billion) and exhibit growth characteristics, such as high earnings growth, high return on equity, and high expected earnings growth. VUG uses a market-cap weighting method, which means it allocates more funds to larger companies in the index.
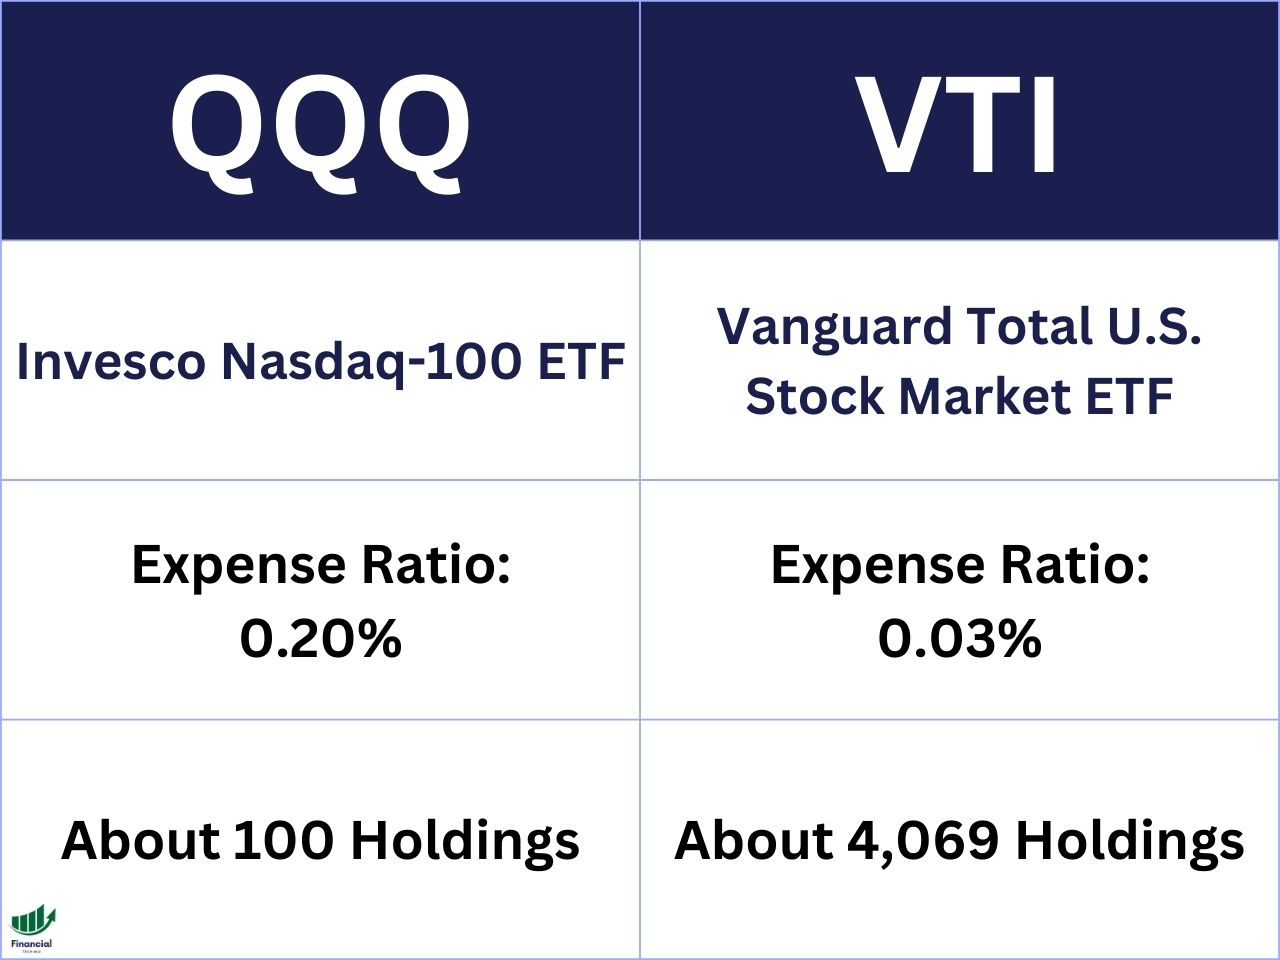
QQQ is the Invesco QQQ Trust, which tracks the Nasdaq-100 Index. This index includes 100 of the largest US and international non-financial companies listed on the Nasdaq stock exchange based on market capitalization. QQQ also uses a market-cap weighting method, but it has a cap of 24% for any single holding to avoid concentration risk.
As you can see, QQQ has a narrower focus than VUG, as it only invests in non-financial companies listed on Nasdaq. This means that QQQ has a higher exposure to technology and innovation sectors, such as information technology, communication services, consumer discretionary, and health care.
VUG, on the other hand, has a broader exposure to various sectors, such as industrials, financials, consumer staples, and energy.
VUG vs. QQQ: Performance
One of the most important factors to consider when choosing between VUG and QQQ is their performance. How have they performed in the past, and how are they expected to perform in the future?
To compare their performance, we can use a tool called TradingView, which allows us to easily plot the price and total return charts of any ETFs or stocks. Price return is the change in the price of an ETF or stock over time, while total return is the change in the price plus any dividends or distributions paid by the ETF or stock over time.
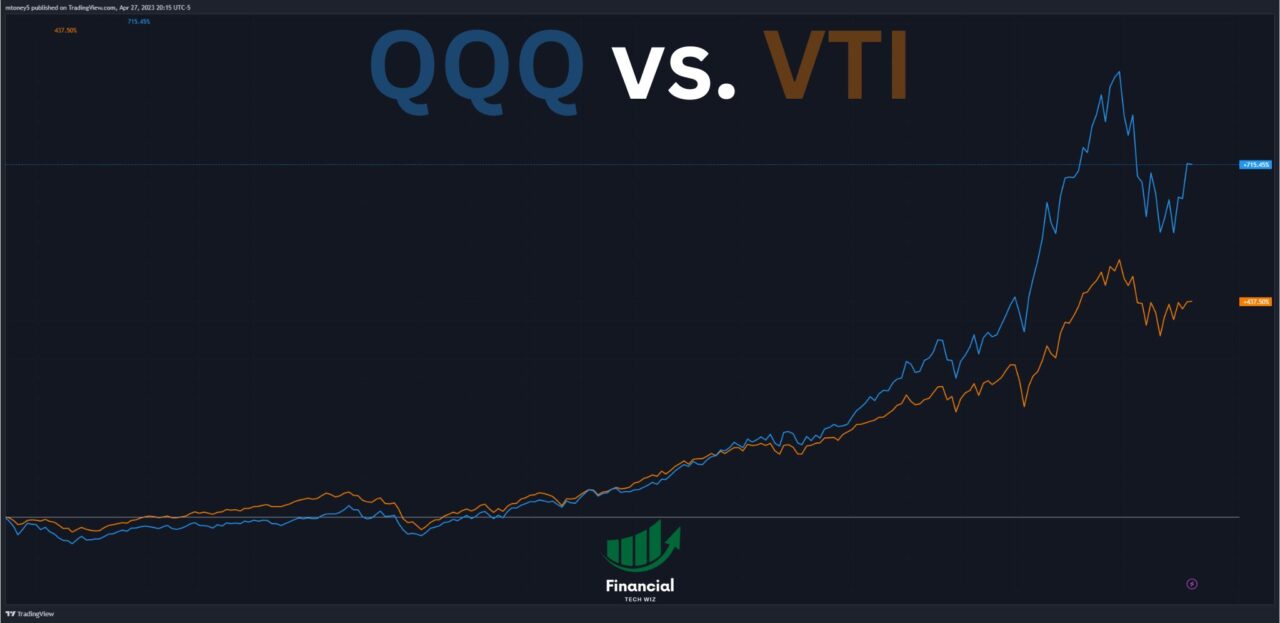
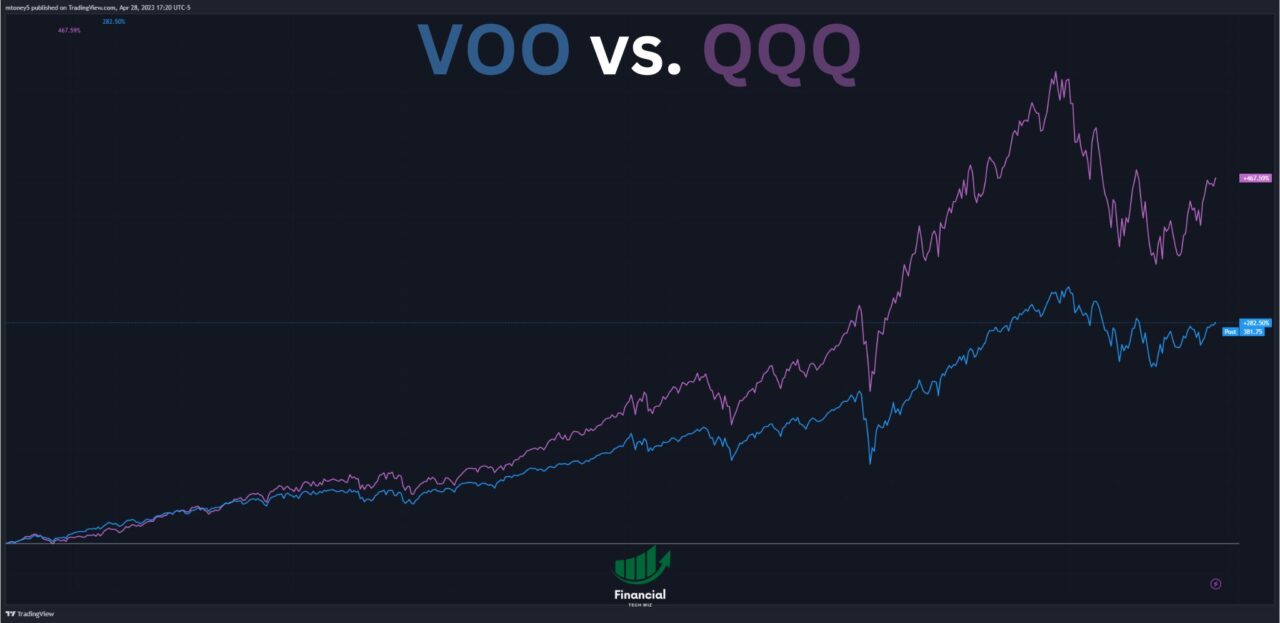
The following TradingView chart shows the total return comparison of VUG and QQQ over the past five years:
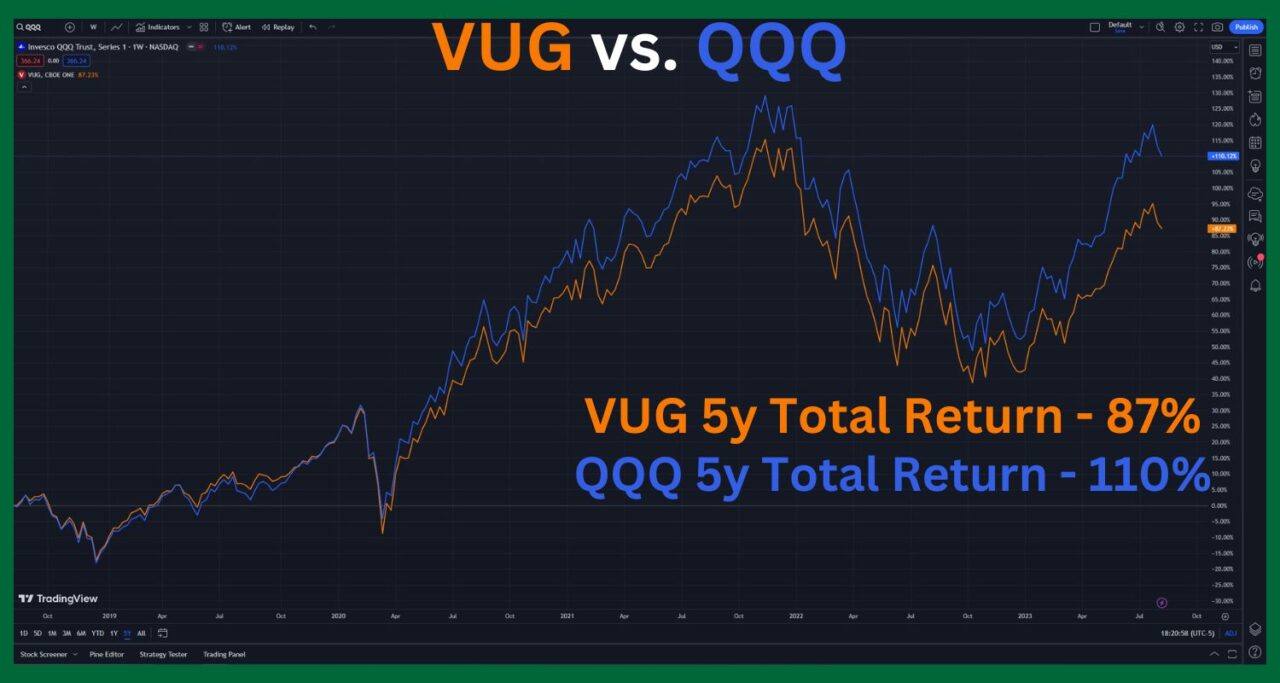
As you can see, QQQ has outperformed VUG by a significant margin over the past five years. QQQ has gained 110% in price, while VUG has gained 87%. This means that if you had invested $10,000 in QQQ five years ago, you would have $21,000 today, while if you had invested in VUG, you would have $18,700 today.
Comparing ETFs With TradingView
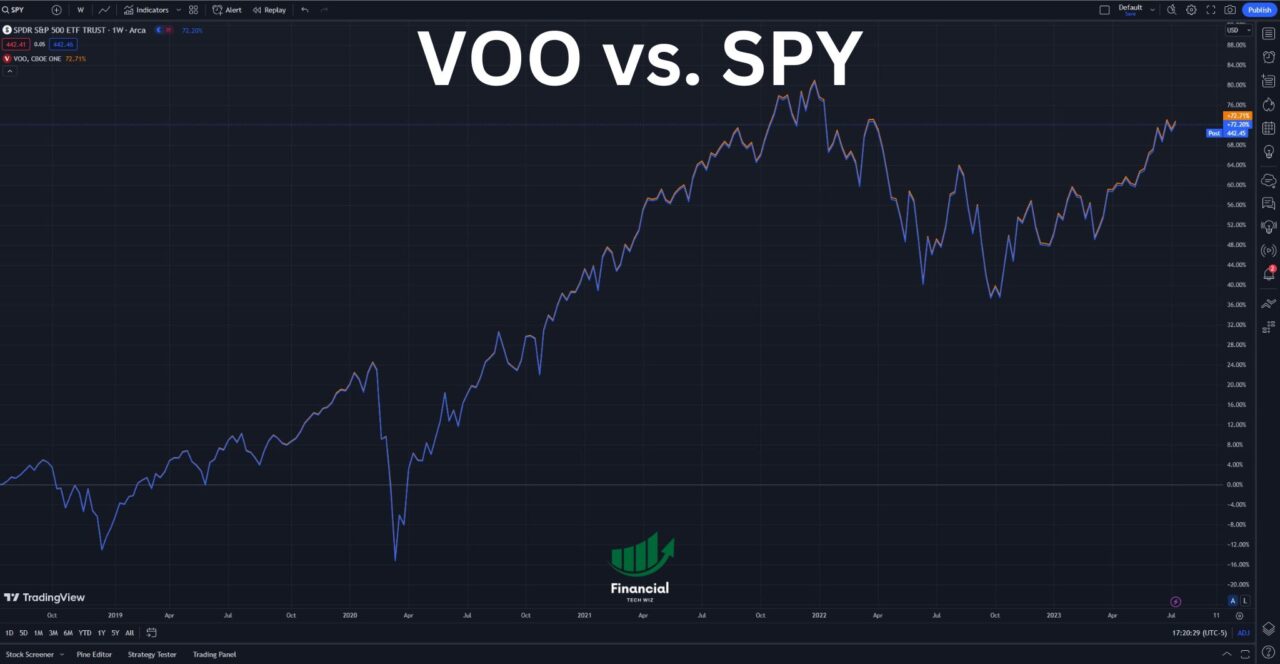
When comparing ETFs, it is crucial that you are comparing the total return to include dividend payments. TradingView allows you to compare several stocks and ETFs at once on a single chart adjusted for dividends.
You can simply sign up for a free TradingView account and type the stock ticker you want to compare. Next, click the plus sign next to the ticker at the top left of the chart to add symbols to compare.
Finally, ensure you click the ‘ADJ’ at the bottom to adjust the returns for dividends!
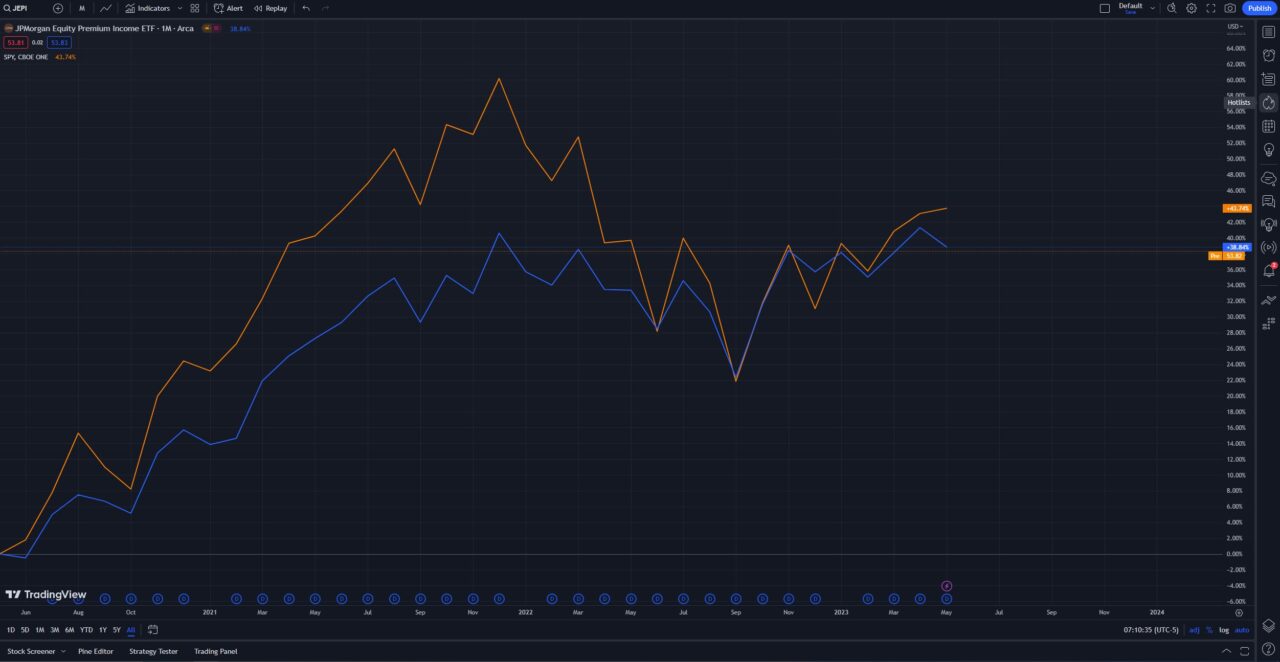
As you can see in the TradingView chart below, you can compare multiple funds and ETFs on a single chart, making your research much easier. Feel free to compare any ETFs you’d like using the widget.

VUG vs. QQQ: Dividend Yield
VUG and QQQ have the same dividend of 0.55%. This means that for every $100 you invest in VUG or QQQ, you receive $0.55 in dividends per year.
However, the dividend yield is not fixed and can change over time. The dividend yield depends on two factors: the dividend or distribution amount and the price of the ETF or stock. The dividend or distribution amount can increase or decrease depending on the profitability and payout policy of the companies or ETFs.
Therefore, it is possible that VUG may pay a higher or lower dividend than QQQ in the future, depending on how these factors change.
VUG vs. QQQ: Expense Ratio
Another factor to consider when choosing between VUG and QQQ is their expense ratio. The expense ratio is the annual fee charged by the ETF provider to cover the operating costs of the fund. The lower the expense ratio, the less you pay in fees and the more you keep in returns.
The expense ratio of VUG is 0.04%, while the expense ratio of QQQ is 0.20%. This means that for every $10,000 you invest in VUG, you pay $4 in fees per year, while for every $10,000 you invest in QQQ, you pay $20 in fees per year.
The difference in expense ratio may seem small, but it can add up over time and affect your long-term returns. For example, if you invest $10,000 in VUG and QQQ for 10 years and assume they both have an annual return of 10%, you will end up with $25,937 in VUG and $25,537 in QQQ. That’s a difference of $400 due to fees alone.
Factors to Consider When Choosing Between QQQ and VUG
As we have seen, VUG and QQQ have some similarities and differences that may affect your investment decision. Here are some factors to consider when choosing between them:
- Number of holdings: QQQ holds 102 stocks, while VUG holds about 235 stocks. This means that QQQ has a more concentrated portfolio than VUG and may be more exposed to specific companies or sectors. On the other hand, VUG has a more diversified portfolio than QQQ and may be less affected by individual companies or sectors.
- Performance: QQQ has outperformed VUG in terms of both price and total return over the past five years. However, past performance is not a guarantee of future results and may change over time. Moreover, performance should be evaluated in relation to risk and volatility.
- Expense ratio: QQQ has a higher expense ratio than VUG (0.20% vs 0.04%). This means that QQQ charges more fees than VUG and may reduce your net returns over time.
- Volatility: QQQ will come with slightly more volatility than VUG because it holds fewer companies. While this can provide higher returns, the downside risk is also greater.
The Financial Tech Wiz ETF Comparison Tool
You can use the ETF comparison tool below to compare over 2,000 ETFs and mutual funds with data I manually collected:
VUG vs. QQQ: Bottom Line
VUG and QQQ are both growth ETFs that offer exposure to some of the most successful and innovative companies in the market. However, VUG holds more companies than QQQ.
Therefore, the choice between VUG and QQQ may depend on your personal preference, risk tolerance, and investment horizon. If you prefer a more focused and aggressive growth strategy, you may opt for QQQ. If you prefer a more balanced and diversified growth strategy, you may opt for VUG.
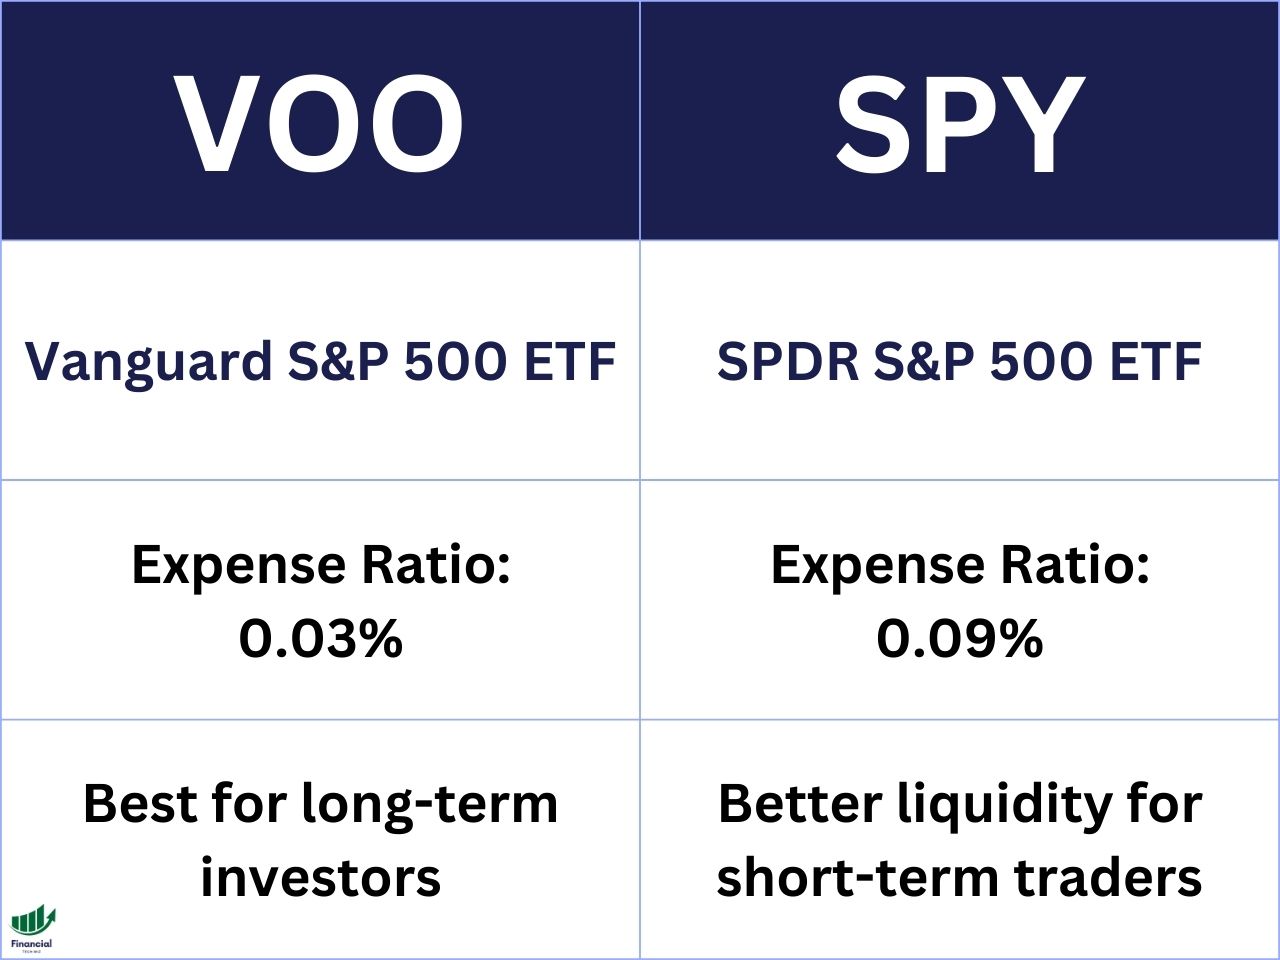
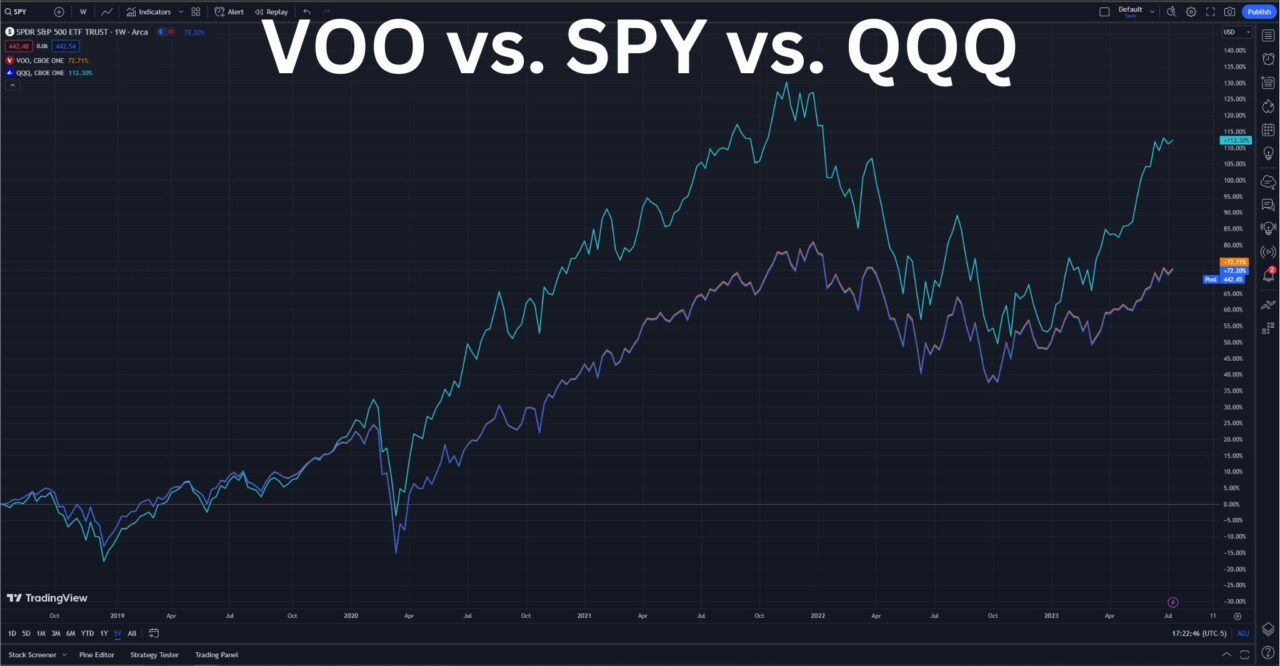
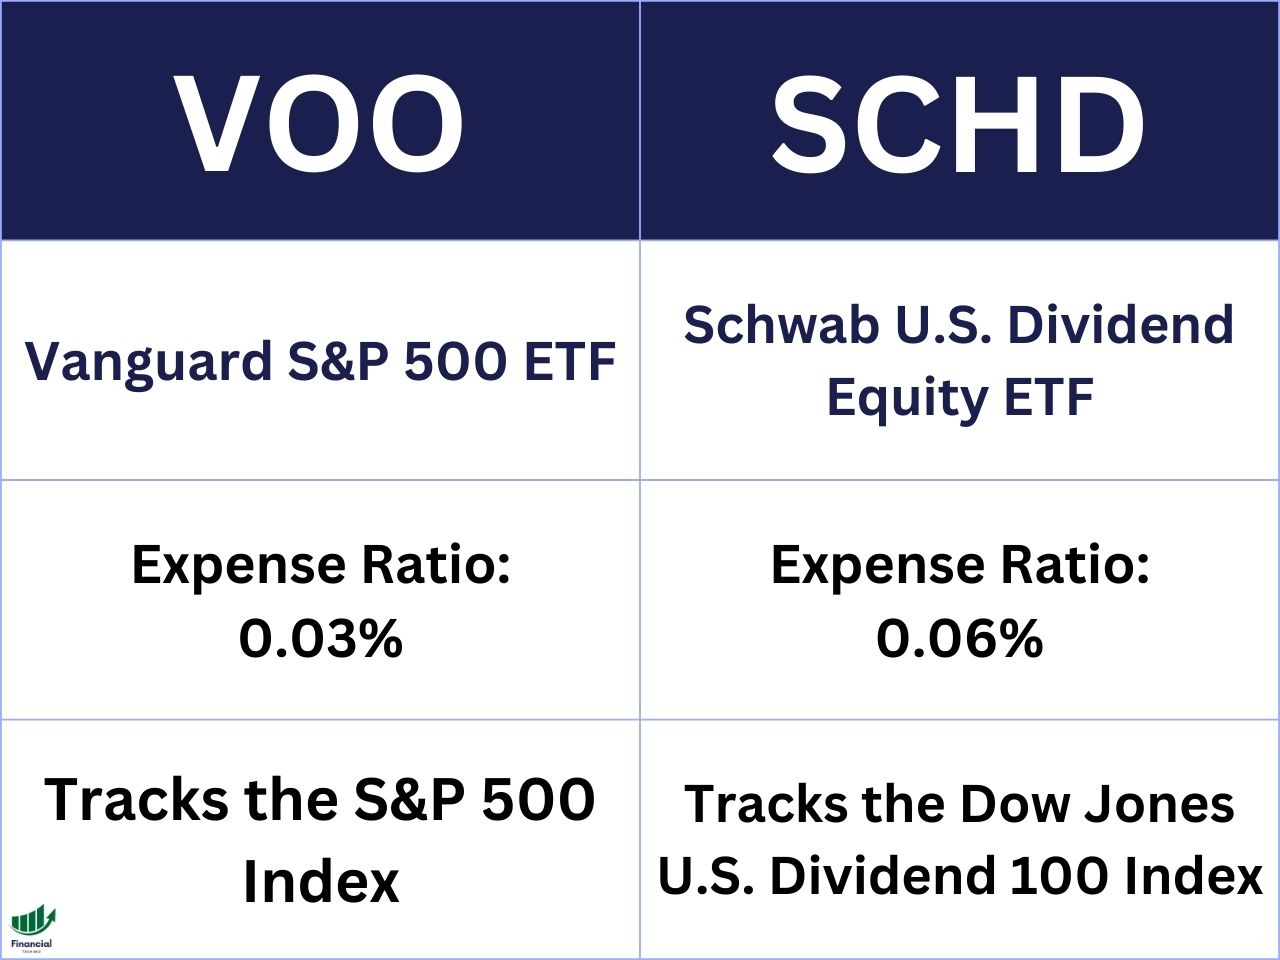
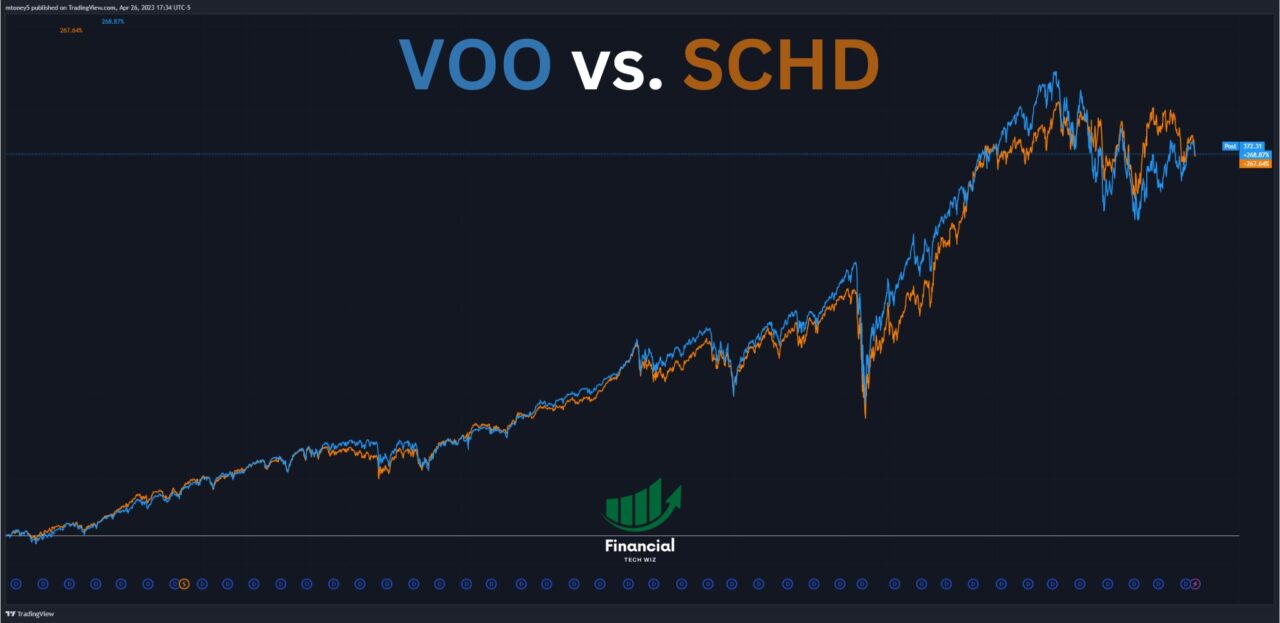
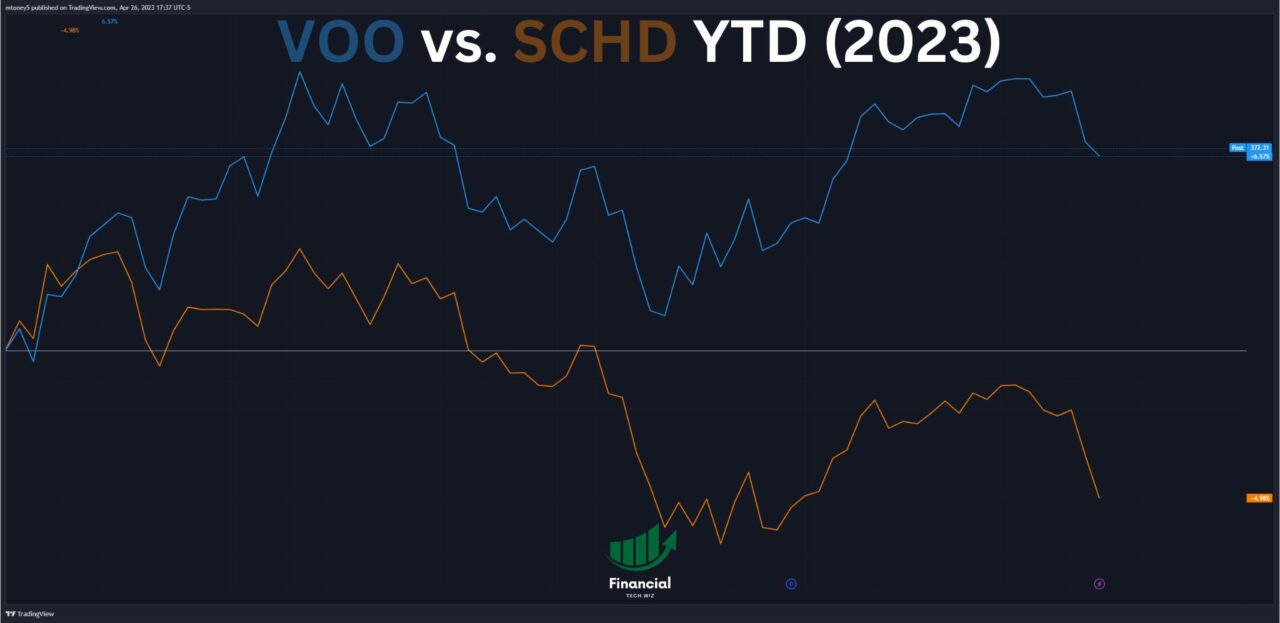
You can also consider my other comparison articles as part of your research, including VOO vs. SCHD, VOO vs. SPY, JEPI vs. JEPQ, VUG vs. VOO, and JEPI vs. SCHD.
Before you go
If you want to keep educating yourself about personal finance, you must check out these posts as well:
What is the Most Successful Options Strategy
Options Trading for Income: The Complete Guide
Mark Minervini's Trading Strategy: 8 Key Takeaways
The Best Options Trading Books
The Best Laptops and Computers for Trading