Stock Rover Review: Features, Pricing, Pros & Cons
Tired of relying on your brokers’ terrible portfolio performance analytics? Stock Rover connects directly with all major brokers and helps you analyze your investments, all from a single platform. It is especially useful if you use multiple brokers. Continue reading to learn why it’s the best tool for self-directed investors like you.

Stock Rover Key Features
- Connect your broker for detailed portfolio analysis tools.
- View and chart key fundamental data for stocks.
- Compare your portfolio to any stock or benchmark like the S&P 500.
- Access powerful stock screeners with custom or pre-built scans.
- Free plan available with paid plans ranging from $5.84–$27.99/month, depending on sales.
Get a two-week free trial and save ~25% on your first year with the link below!
Start Your Free TrialWho is Stock Rover Best For?
Stock Rover is best for long-term investors who want detailed analytics reports of all of their portfolios on one platform. It is also great for stock research, screening, comparisons, and so much more.
Summary of Stock Rover’s Features
- User Dashboard: A fully customizable performance tracker with heat maps, sector insights, and income projections.
- Brokerage Connect: Automatically syncs and updates your real portfolio with Stock Rover.
- Charting: Compare stocks, ETFs, and portfolios while visualizing fundamental and technical data.
- Screeners: Create custom or use prebuilt stock filters with advanced metrics.
- Stock Insights: In-depth company analysis with red-flag alerts and competitor comparisons.
- Rebalancing Tool: Easily adjust your portfolio to match target allocations.
Click the links above to jump to the detailed review sections in this article.
Stock Rover Pros and Cons
Pros
- Excellent fundamental analysis tools, like the ability to chart metrics like revenue and P/E ratios.
- Connects directly with your broker to track all your portfolios on a single platform.
- The future income tool is great for dividend investors.
- Affordable pricing starting around $5/month, with available discounts.
Cons
- The platform could look more modern, but it covers all necessary features.
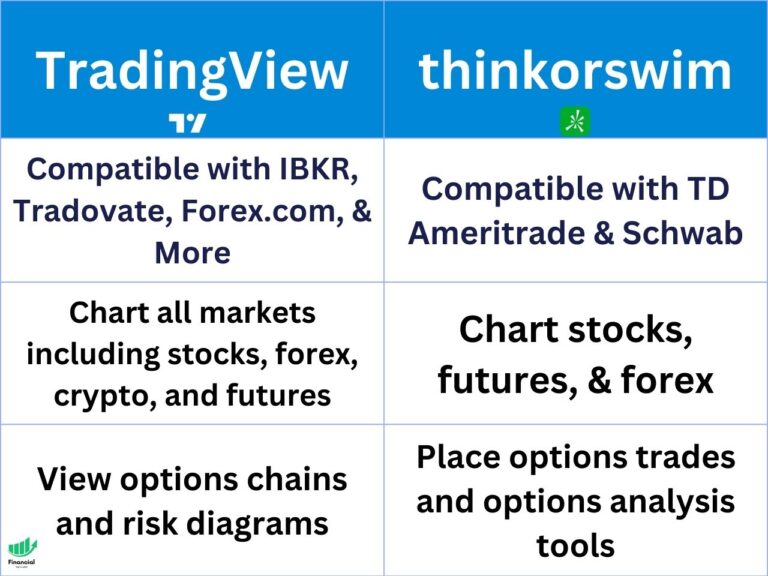
- Charting and technical analysis tools are basic compared to platforms like TradingView.
- Not suitable for day traders.
Review of Stock Rover’s Features
User Dashboard
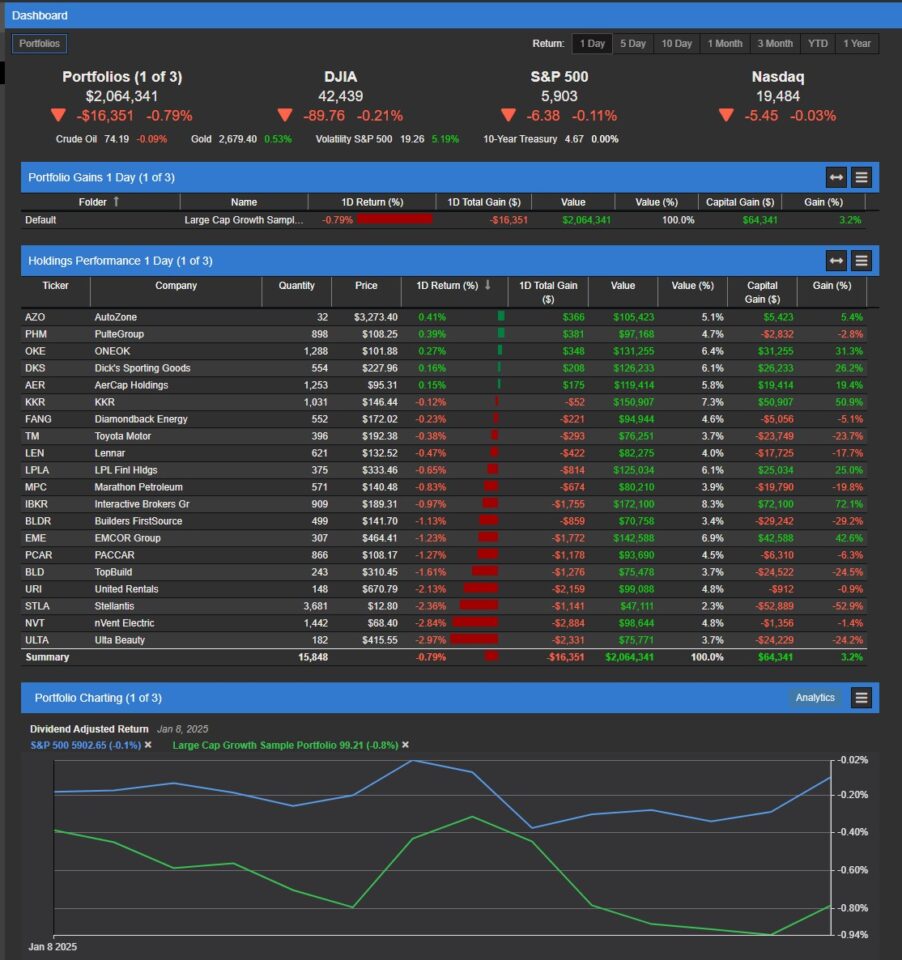
Stock Rover’s User Dashboard is highly customizable. You can move widgets up and down to organize the layout to your preference. The dashboard provides a quick performance comparison against benchmarks and allows you to adjust the timeframe for long-term and short-term analytics.
Key features include:
- Holdings Heat Map: Easily spot the performance of individual stocks in your portfolio.
- Sector Performance: Track how different sectors are performing in the market.
- Market Movers Tracker: Stay updated on top movers in the stock market.
- Portfolio Charting: Visualize your portfolio performance compared to a benchmark or any stock.
- Earnings Calendar: Keep track of upcoming earnings reports.
- Future Projected Income: See potential future dividend income for your investments.
Brokerage Connect
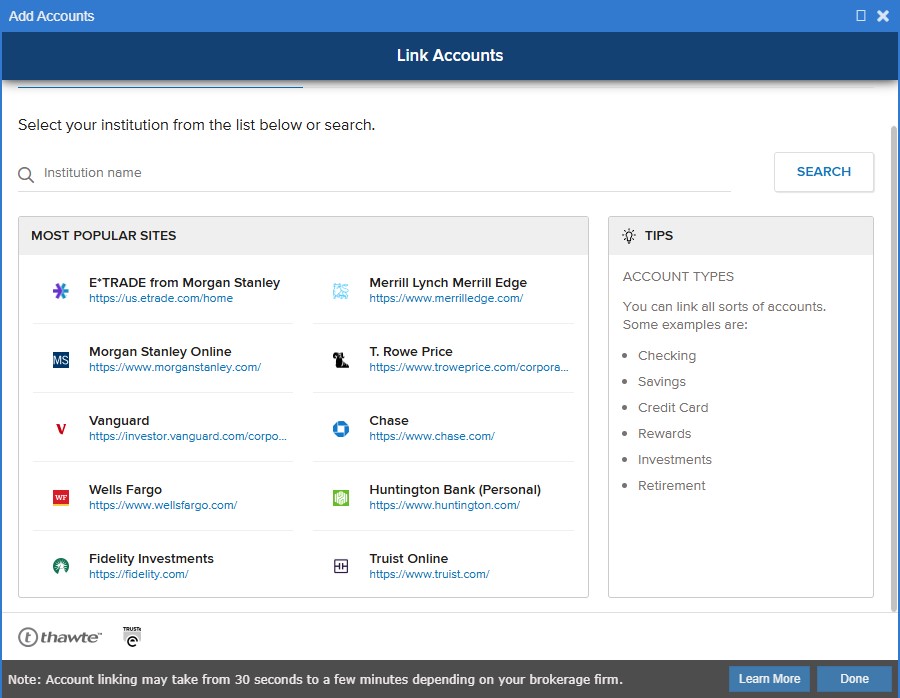
Brokerage Connect is a seamless feature that allows you to connect your brokerage account to Stock Rover. Once connected, Stock Rover will automatically pull and update your positions, simplifying the tracking process.
Key points:
- Simple Setup: Connecting your brokerage is straightforward and user-friendly.
- Track Buys and Sells: Stock Rover tracks your buys and sells at the end of each trading day (not designed for day traders).
- Historical Data: You can import historical performance data or simulate past performance based on your current holdings.
Charting
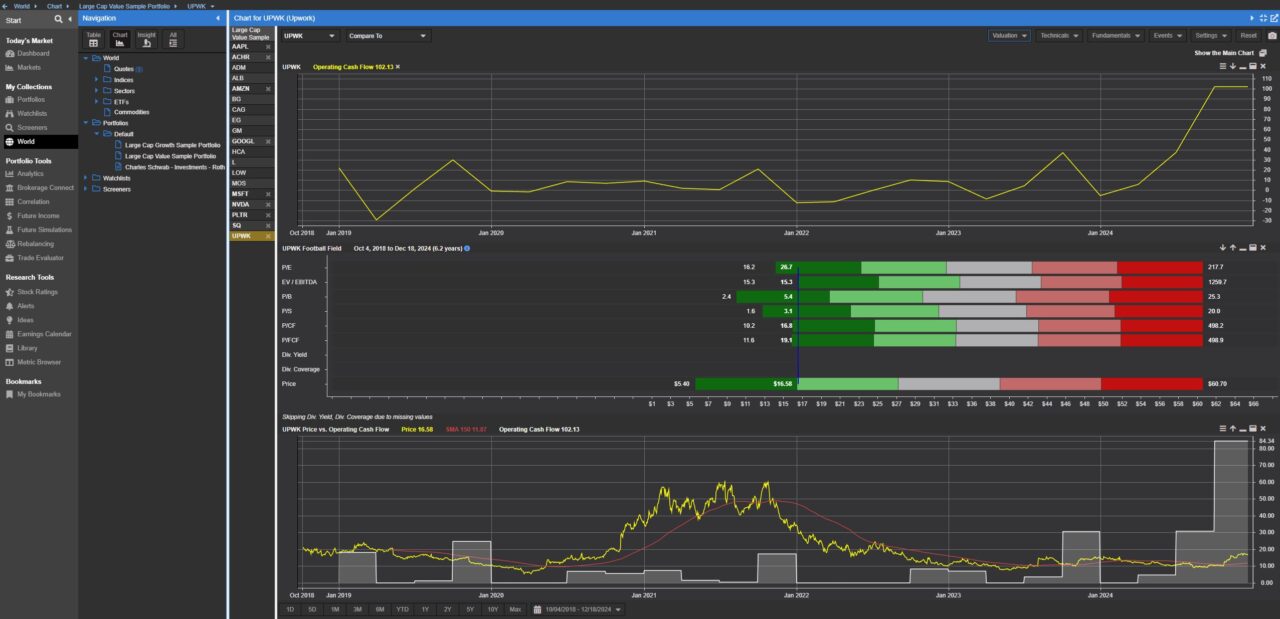
Stock Rover’s Charting capabilities are robust, offering advanced visualizations for both stocks and portfolios. You can compare any stock, ETF, or your entire portfolio against others, including benchmarks like the S&P 500.
Key charting features:
- Compare Stocks and ETFs: Analyze how different assets perform relative to one another.
- Visualize Key Events: Note important events like earnings reports are marked on the chart.
- Fundamental Data Charts: Unlike most competitors, Stock Rover allows you to chart fundamental data such as revenue, P/E, P/S ratios, OCF, and more.
- Basic Technical Indicators: Includes RSI, volume, and a unique volume-by-price chart.
- Football Field Tool: A valuable tool that shows current data in the center, with green areas indicating better than average value and red areas showing worse than average value.
Screeners
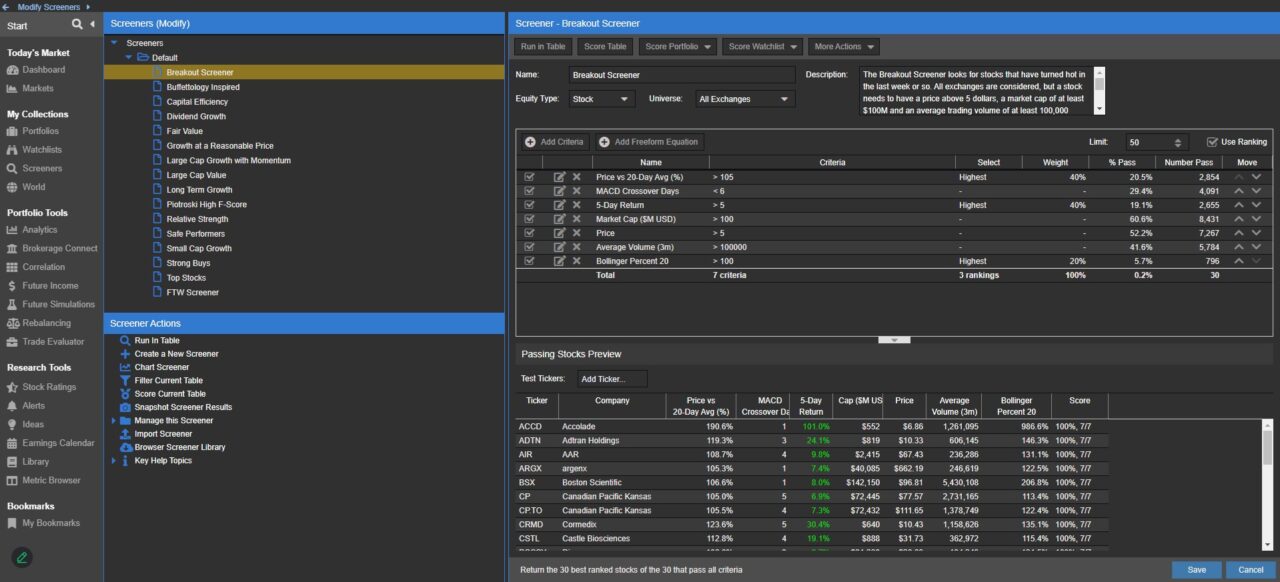
Stock Rover offers an advanced stock screener with a wide range of customization options, making it easy to find stocks that meet specific criteria.
Key features:
- Fundamental Ratios: Screen for common ratios like P/E, P/S, and dividend growth.
- Customizable Criteria: Create custom screeners or use premade ones to find stocks based on various parameters like sales growth, free cash flow, and more.
- Freeform Equations: If you have a specific screening method in mind, Stock Rover allows you to create custom equations.
Stock Insights
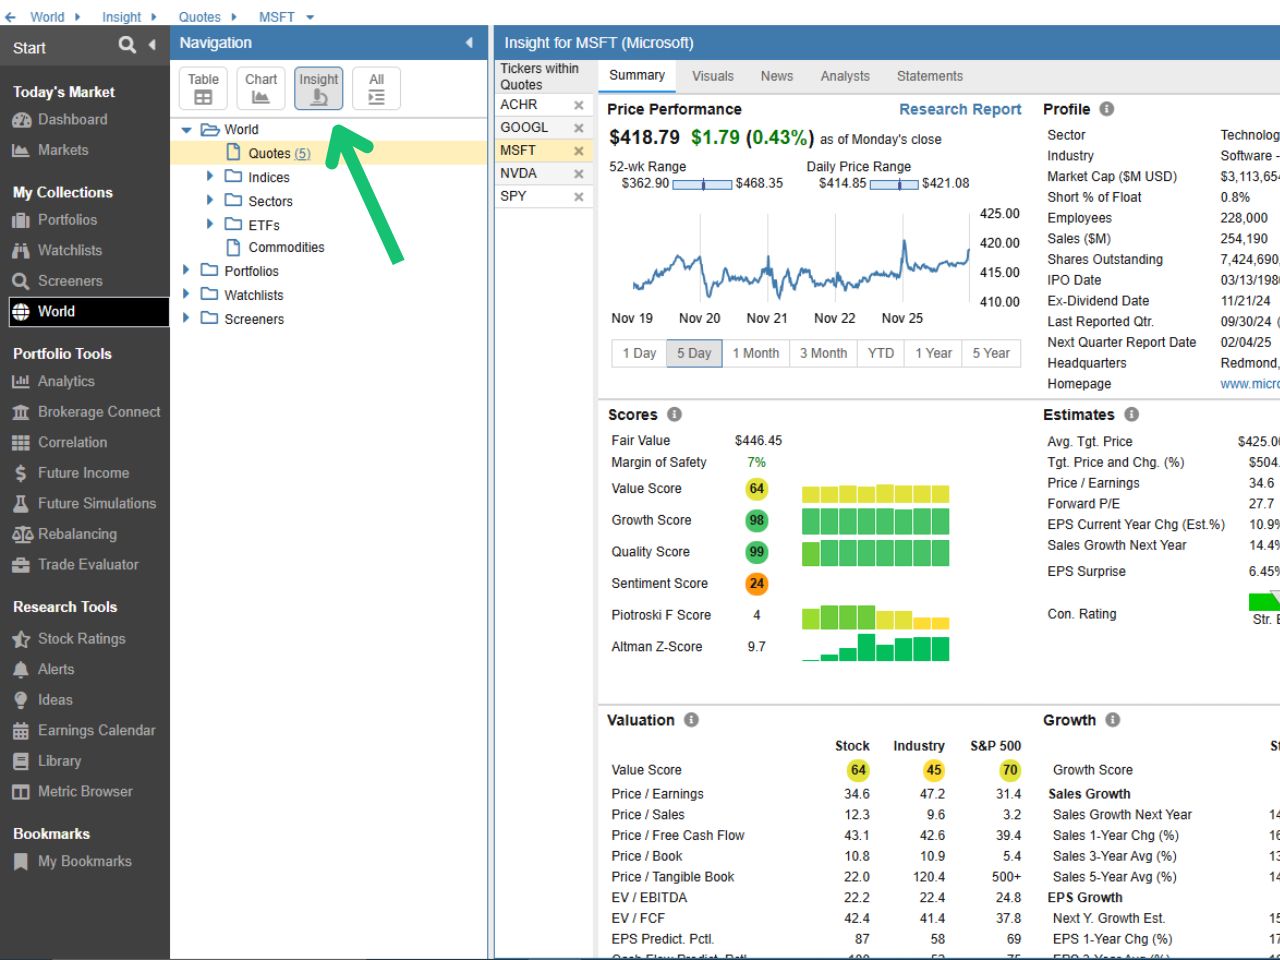
The Stock Insights tab is a powerful tool that provides in-depth analysis of any ticker. You simply type in the ticker symbol, and you gain access to a wide array of data about the company, all in one place.
Key features:
- Comprehensive Data: View everything from market cap, short percentage, and dividend growth to custom value scores.
- Comparison with Competitors: Stock Rover compares these metrics to the company’s competitors, its industry, and the S&P 500.
- Warning Labels: The insights tab automatically detects red flags or metrics that investors should be cautious of, helping you make informed decisions.
Rebalancing Tool
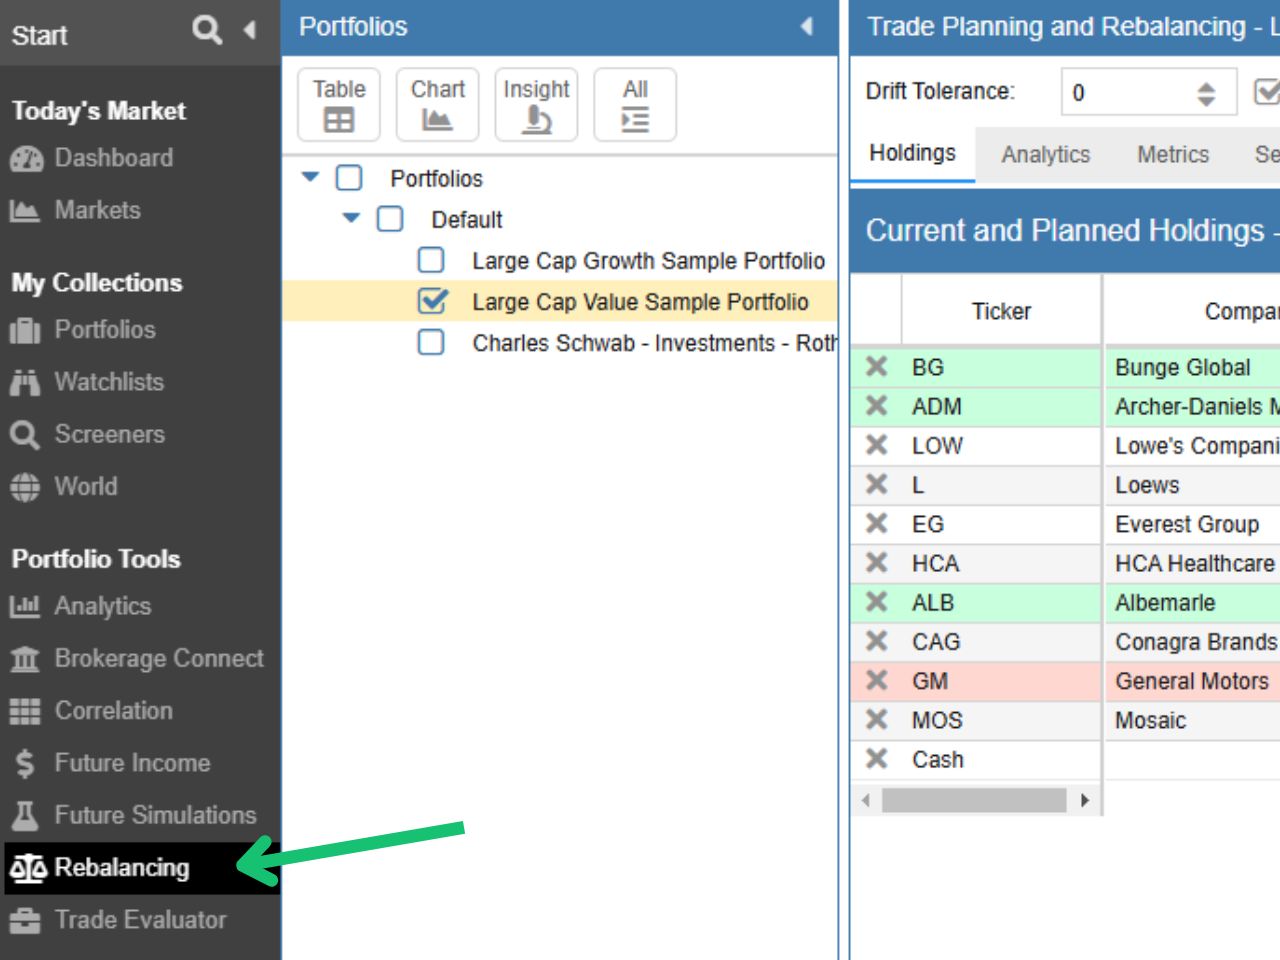
The Rebalancing Portfolio Tool is an excellent feature for managing portfolio allocations. It allows you to simulate rebalancing your portfolio according to your preferred percentage allocations.
Key features:
- Set Preferred Allocations: Choose the percentage allocation for each position in your portfolio.
- Automatic Rebalancing: If you want to move to a certain percentage of cash, Stock Rover calculates how much of each position to sell to match your desired allocation.
- Maintain Control: This tool is perfect for those who want to maintain precise control over their portfolio’s composition.
Stock Rover Pricing & Plans Compared
Stock Rover Essentials
$79.99 billed annually
Entry level plan
- 8,500+ North American stocks
- 275+ financial metrics
- 5 years of financial history
- Flexible screening and charting
- Portfolio management tools
You can get a two-week free trial and save ~25% using the link above.
Stock Rover Premium
$179.99 billed annually
Includes everything in Essentials, plus:
- 375+ metrics and 10 years of history
- Advanced screening and alerts
- Portfolio analytics and rebalancing
- Monte Carlo simulations
- Future dividend projections
You can get a two-week free trial and save ~25% using the link above.
Stock Rover Premium Plus
$279.99 billed annually
Includes everything in Premium, plus:
- 700+ metrics and custom equations
- Stock ratings and valuation tools
- Historical scoring and warnings
- Advanced charts and visualizations
- Priority email support
You can get a two-week free trial and save ~25% using the link above.
Is There a Stock Rover Free Trial?
You can get a two-week Stock Rover free trial for any of the paid plans by signing up using my free trial affiliate link. A credit card is not required to access the free trial, allowing you to test the platform completely risk-free.
FAQ About Stock Rover
Is Stock Rover data real-time?
Stock Rover data and screeners are real-time, but it is not reliable for people seeking real-time stock charts. TradingView is a better option for active day traders who need real-time charting.
Is there a Stock Rover mobile app?
While there is not an official Stock Rover app, it is mobile-friendly via your phone’s web browser. When you visit the Stock Rover website on your phone, you can click mobile to access the mobile-friendly version, which actually works incredibly well.
Is Stock Rover good for day trading?
No, Stock Rover does not provide real-time charting, and the brokerage connect features only updates at the end of the day. Therefore, any day trades placed will not be accurately imported into the Stock Rover platform.
– Free trading journal template & cheat sheet PDFs
– Access our custom scanners and watchlists
– Access our free trading course and community!


