Ascending Triangle Pattern: A Comprehensive Guide
The ascending triangle pattern is a chart pattern that traders often encounter in the world of technical analysis. This powerful pattern can provide important insights into the potential future direction of a financial asset.
In this article, we’ll explore the key characteristics of the ascending triangle, its significance as a continuation pattern, and how traders use it to make informed trading decisions.
Characteristics of the Ascending Triangle Pattern
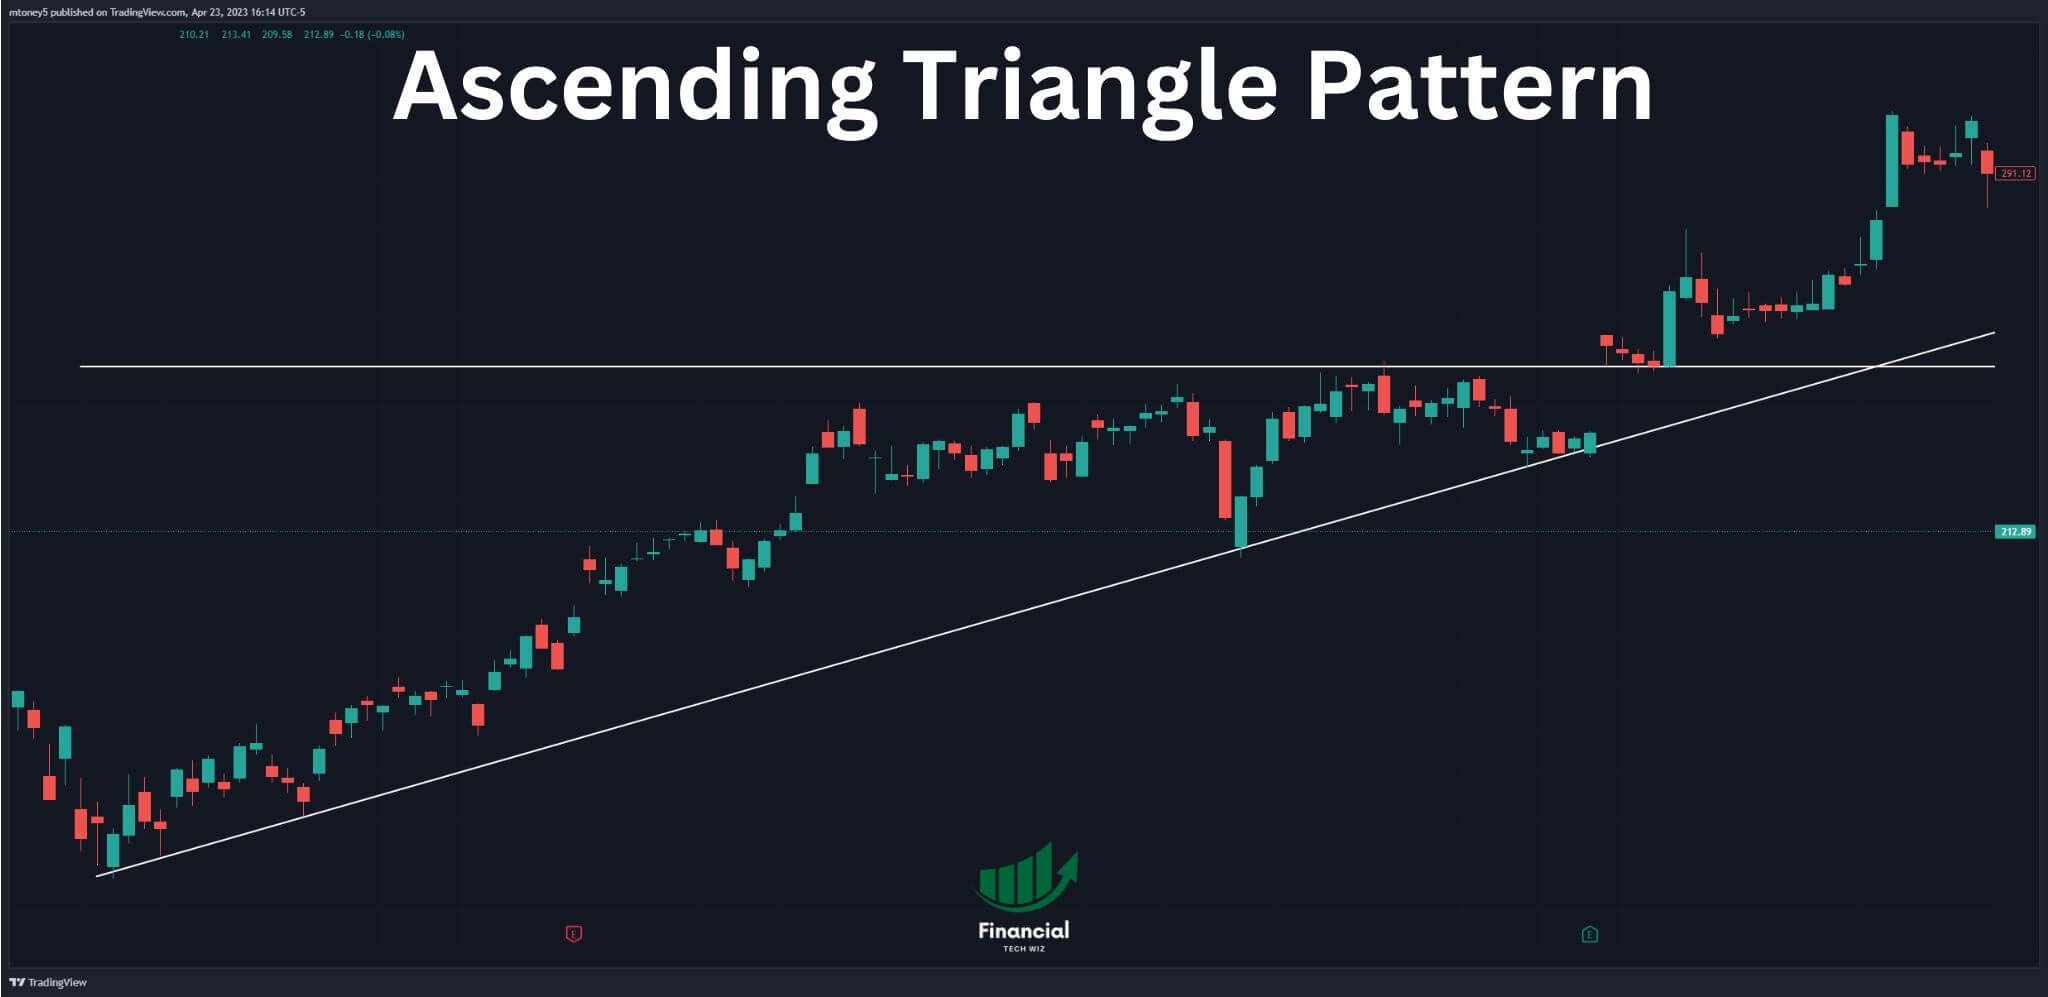
An ascending triangle is formed by two converging trendlines: a horizontal resistance line and a rising support line. The horizontal line connects at least two swing highs, while the rising line connects at least two swing lows. Together, these lines form a triangle shape.
One of the key attributes of the ascending triangle is its classification as a continuation pattern. This means that the pattern typically signals a continuation of the prevailing trend. In other words, if the pattern forms during an uptrend, the price will likely continue upward after the breakout.
Interpreting Bullish and Bearish Signals
While ascending triangles are often considered bullish patterns, they can also signal bearish reversals, depending on the context. An ascending triangle that forms during an uptrend is typically seen as a bullish continuation pattern, indicating that the price will likely break out upward.
Conversely, an ascending triangle that forms during a downtrend may signal a bearish continuation, suggesting a potential downside breakout. The direction of the breakout ultimately depends on the prevailing market conditions and the behavior of buyers and sellers.
Identifying the Pattern on a Chart
To successfully identify an ascending triangle pattern, traders look for the following criteria:
- Two or more swing highs connected by a horizontal resistance line.
- Two or more swing lows connected by a rising support line.
- Multiple touches of both trendlines for greater reliability.
It’s important to note that a greater number of trendline touches increases the validity of the pattern and its potential for a strong breakout.
Trading Strategies with the Ascending Triangle
Once an ascending triangle pattern has been identified, traders watch for a breakout in either direction. Here are some key steps for trading the pattern:
- Enter a long trade if the price breaks above the horizontal resistance line.
- Enter a short trade if the price breaks below the rising support line.
- Set a stop-loss order just outside the opposite side of the pattern.
- Calculate a profit target based on the height of the triangle added or subtracted from the breakout point.
TradingView is a popular charting platform that traders can use to analyze and identify ascending triangle patterns and other technical chart patterns.
Caveats and Limitations
While ascending triangles provide valuable insights, they are not without limitations. Traders should be cautious of false breakouts, where the price moves out of the pattern only to reverse direction. Additionally, profit targets based on the triangle’s height are only estimates and may not always be reached.
Market Psychology Behind the Pattern
The psychology of the ascending triangle is characterized by the struggle between buyers and sellers. As the price approaches the resistance line, selling pressure prevents further upward movement. However, buyers remain persistent, creating higher lows and forming the rising support line. The eventual breakout reflects the resolution of this tug-of-war.
The Ascending Triangle Pattern and Its Counterparts
In technical analysis, the ascending triangle is one of several chart patterns traders utilize to gain insights into potential price movements. Understanding how the ascending triangle compares to other patterns can enhance a trader’s ability to interpret market trends and make informed decisions.
Let’s compare the ascending triangle with a few related chart patterns.
The Descending Triangle: A Mirror Image
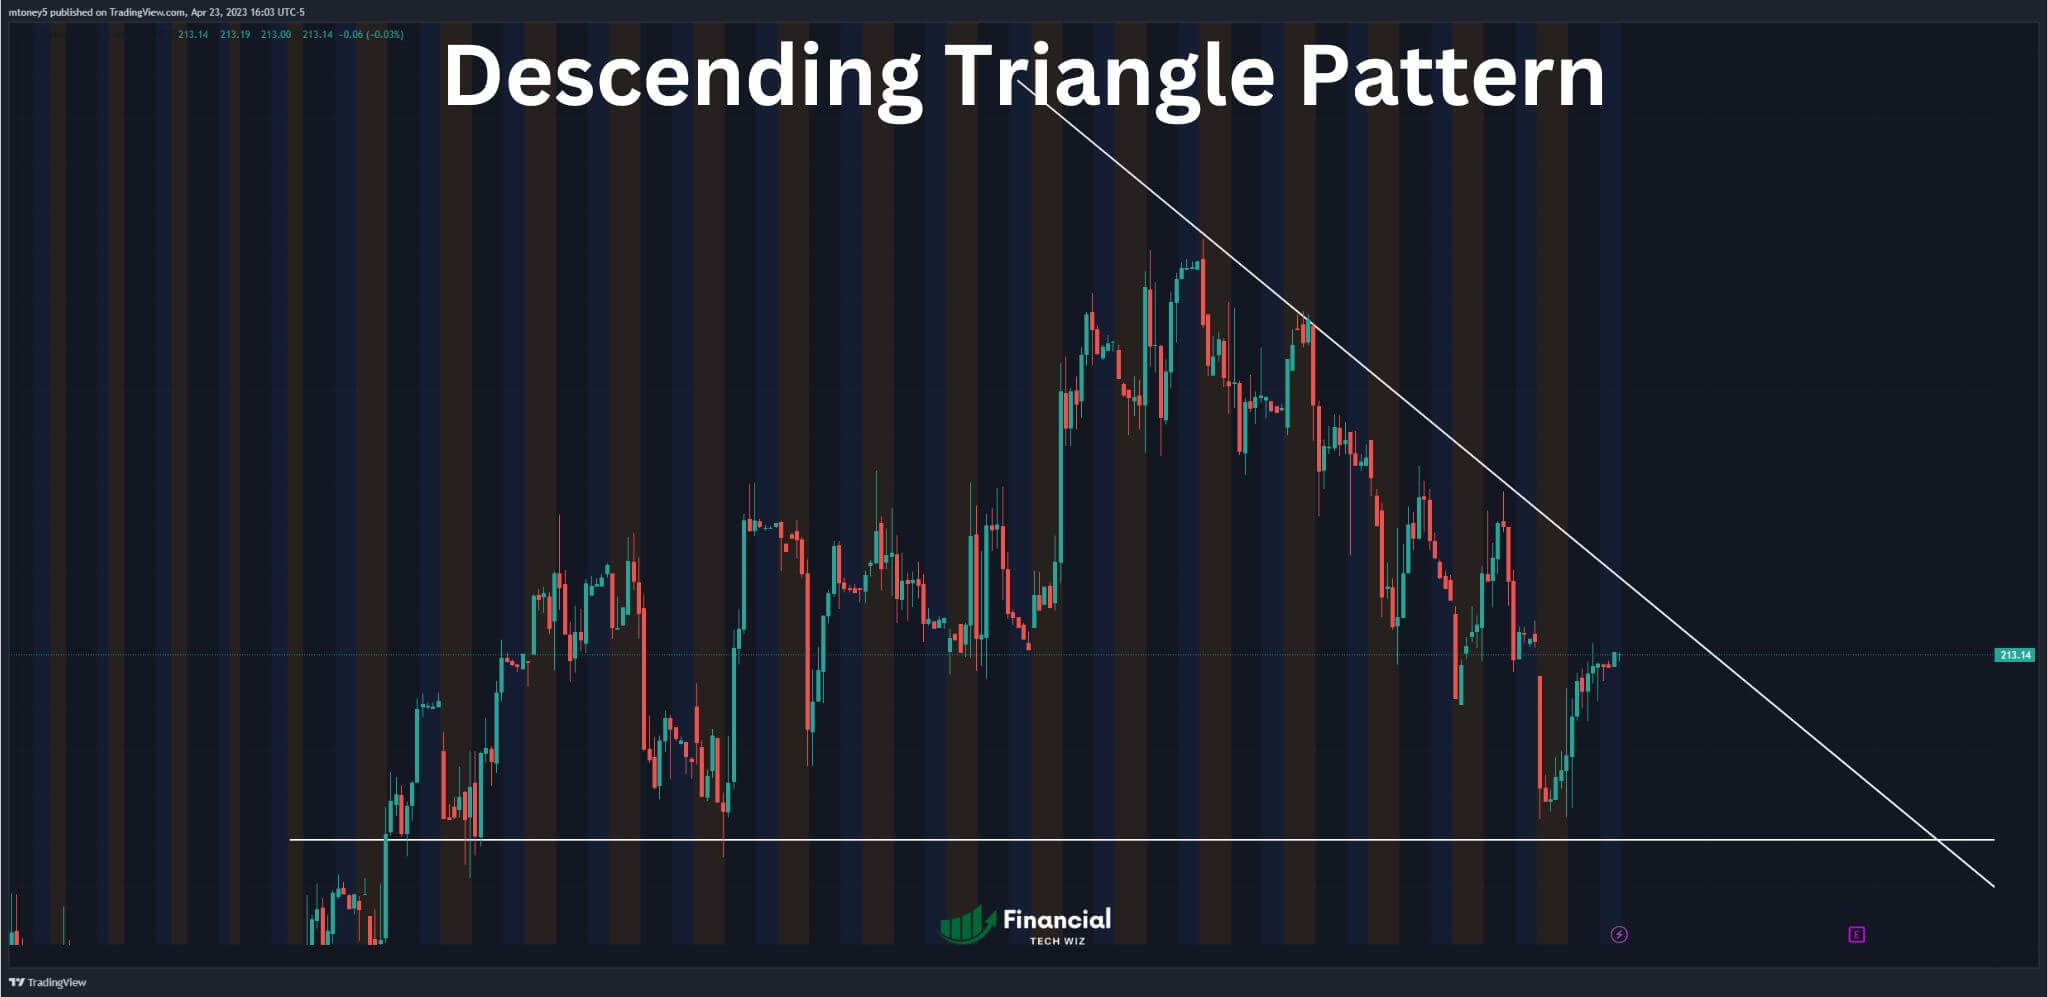
While the ascending triangle is characterized by a horizontal resistance line and an upward-sloping support line, the descending triangle is, in many ways, its mirror image.
The descending triangle features a horizontal support line and a downward-sloping resistance line. Both patterns are considered continuation patterns, and the direction of the breakout is typically aligned with the prevailing trend. Traders can learn more about this pattern in our article on the descending triangle pattern.
The Cup and Handle: A Bullish Continuation Signal
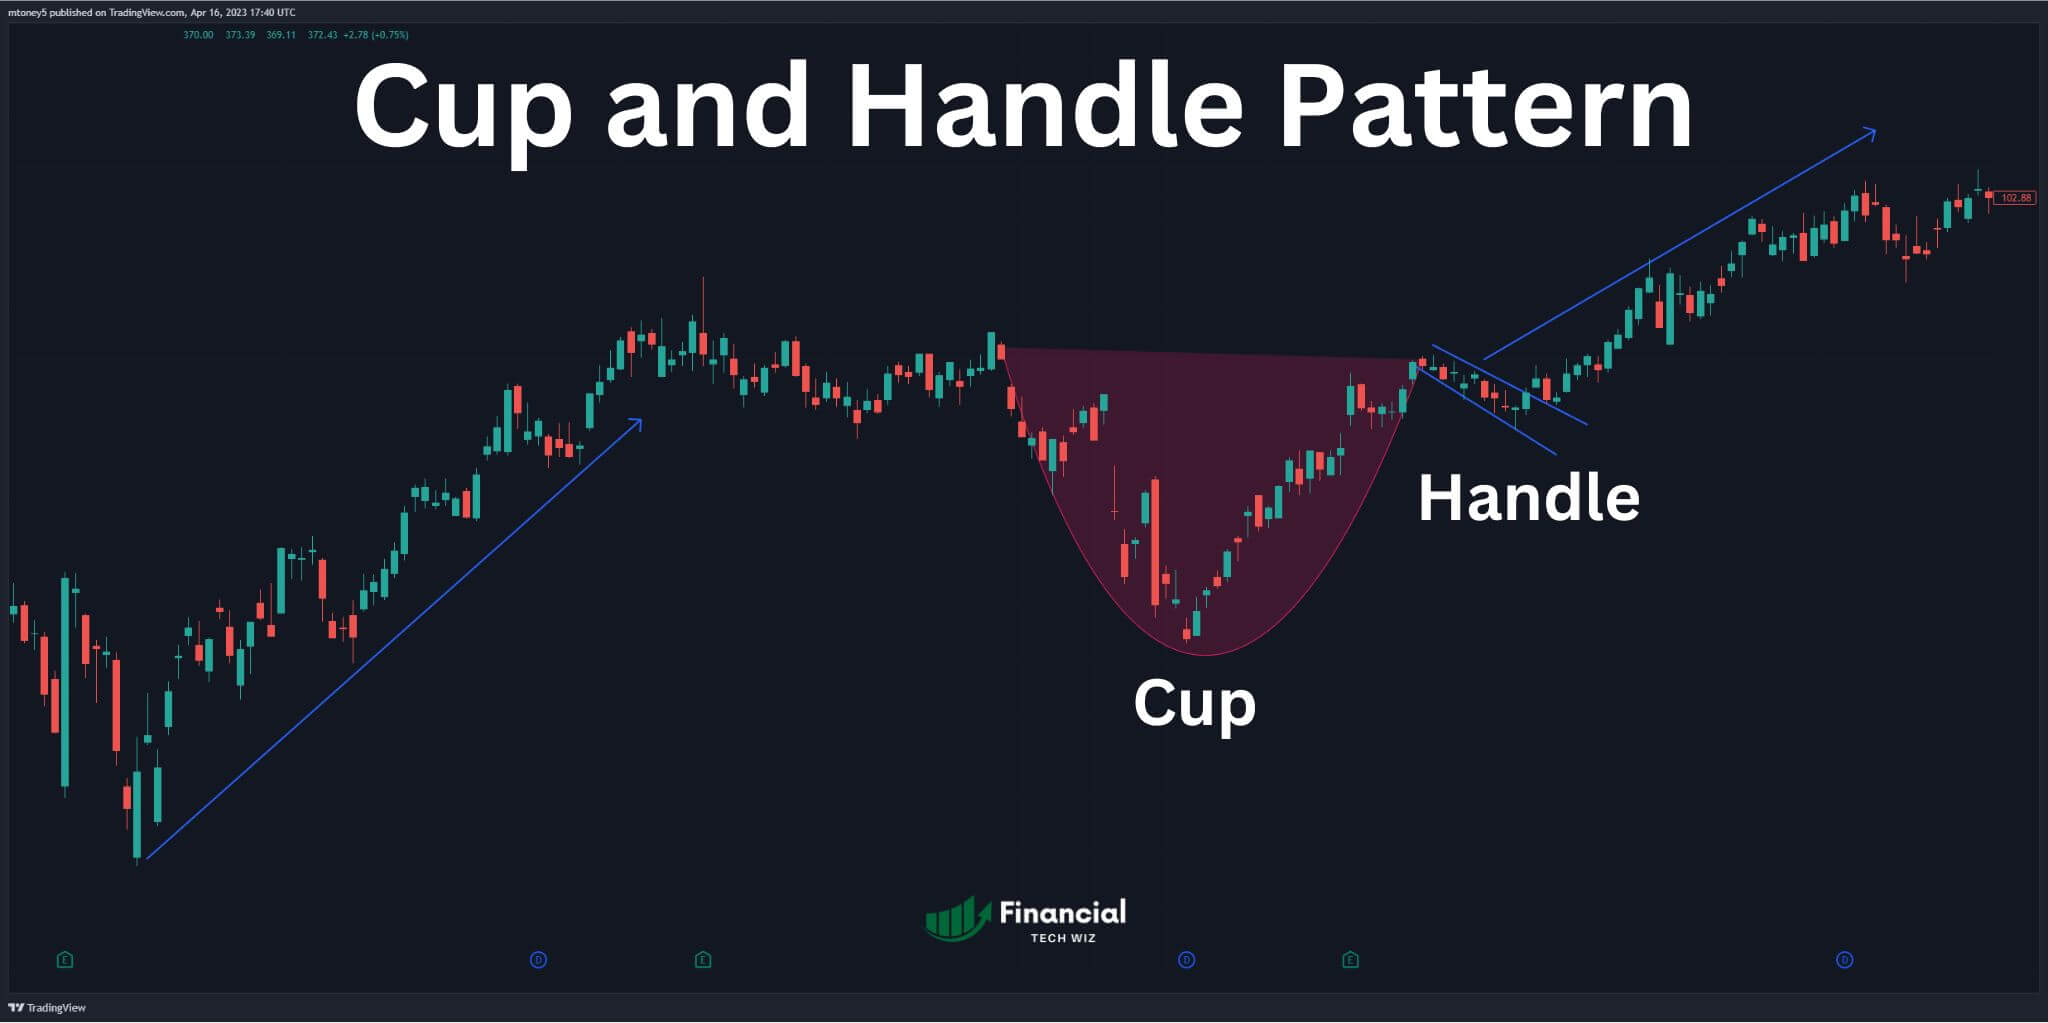
The cup and handle pattern is another well-known bullish continuation pattern. It consists of a rounded “cup” shape followed by a smaller “handle” consolidation. The completion of the handle often signals a potential upward breakout.
The ascending triangle shares similarities with the handle portion of this pattern, as both indicate a period of consolidation before a potential continuation. Discover more about this pattern in our article on the cup and handle pattern.
The Morning Star
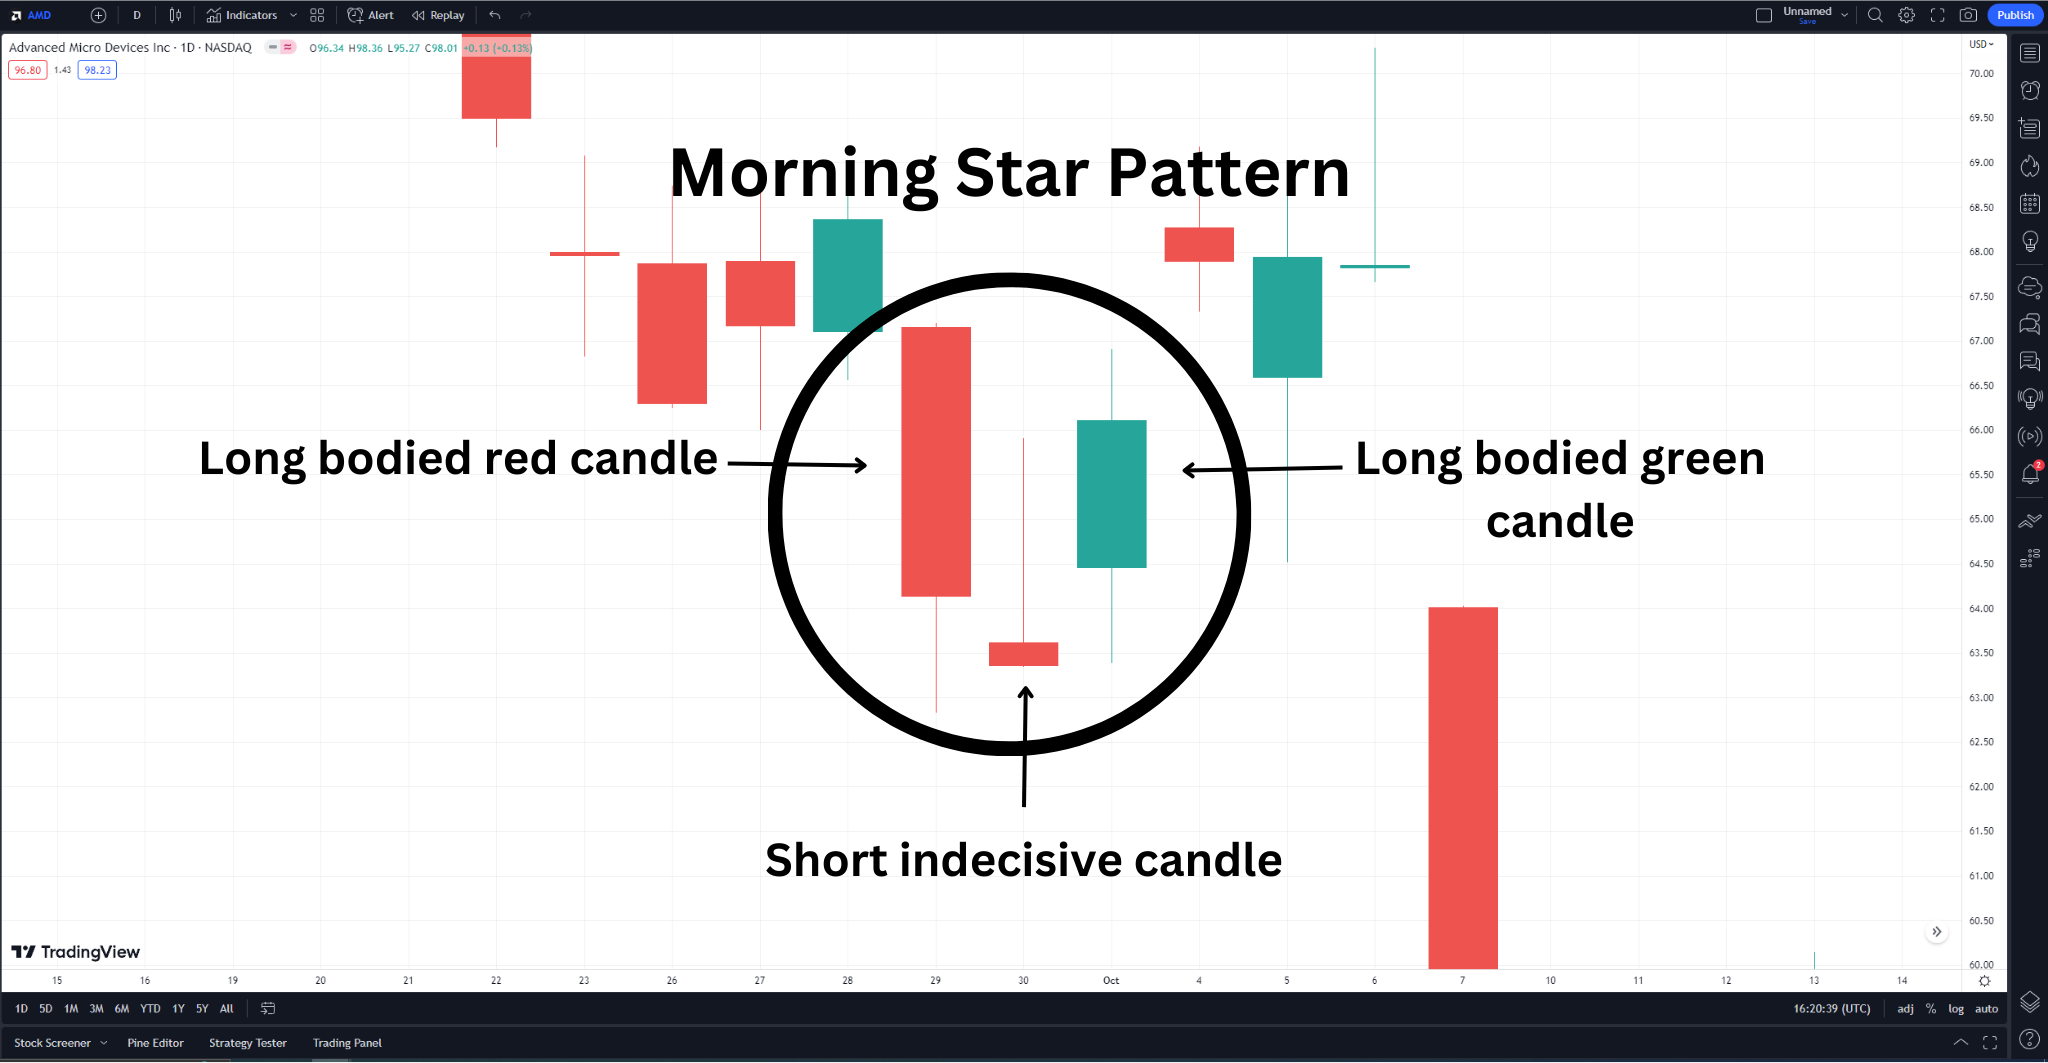
Unlike continuation patterns, the morning star pattern is a bullish reversal pattern that often appears at the end of a downtrend. It consists of three candlesticks: a long bearish candle, a small-bodied candle indicating indecision, and a long bullish candle signaling a reversal.
While the ascending triangle anticipates a continuation of the trend, the morning star suggests a change in direction. Traders can delve into this pattern further in our article on the morning star pattern.
Harnessing the Ascending Triangle for Informed Trading
The ascending triangle pattern is a versatile tool in the trader’s arsenal. It provides valuable insights into the potential continuation of prevailing trends and helps traders make informed entry and exit decisions.
By understanding the characteristics, interpretation, and psychology of the ascending triangle, traders can better navigate the financial markets and capitalize on potential breakout opportunities.
For those looking to analyze and trade chart patterns, TradingView is an excellent platform that offers powerful charting tools and real-time market data. Whether you’re a novice trader or a seasoned expert, TradingView can enhance your technical analysis and help you spot promising opportunities.
As you explore the fascinating world of technical analysis, be sure to check out other related patterns, such as the descending triangle, cup and handle, and morning star patterns. By broadening your knowledge, you’ll be better equipped to navigate the ever-changing landscape of the financial markets.
This article contains affiliate links I may be compensated for if you click them.
– Free trading journal template & cheat sheet PDFs
– Access our custom scanners and watchlists
– Access our free trading course and community!


