Descending Triangle Pattern: Trading the Breakdown
Technical analysis is an essential component of successful trading, allowing traders to identify and exploit key chart patterns to make informed decisions. One such pattern, known as the descending triangle, offers valuable insights into potential price movements.
In this article, we’ll explore the intricacies of the descending triangle pattern and its significance as a trader. To visualize the concepts discussed in this article, consider using TradingView, a popular charting platform that offers powerful tools for traders.
TradingView will allow you to draw lines on your chart when you spot a pattern.
What is the Descending Triangle Formation
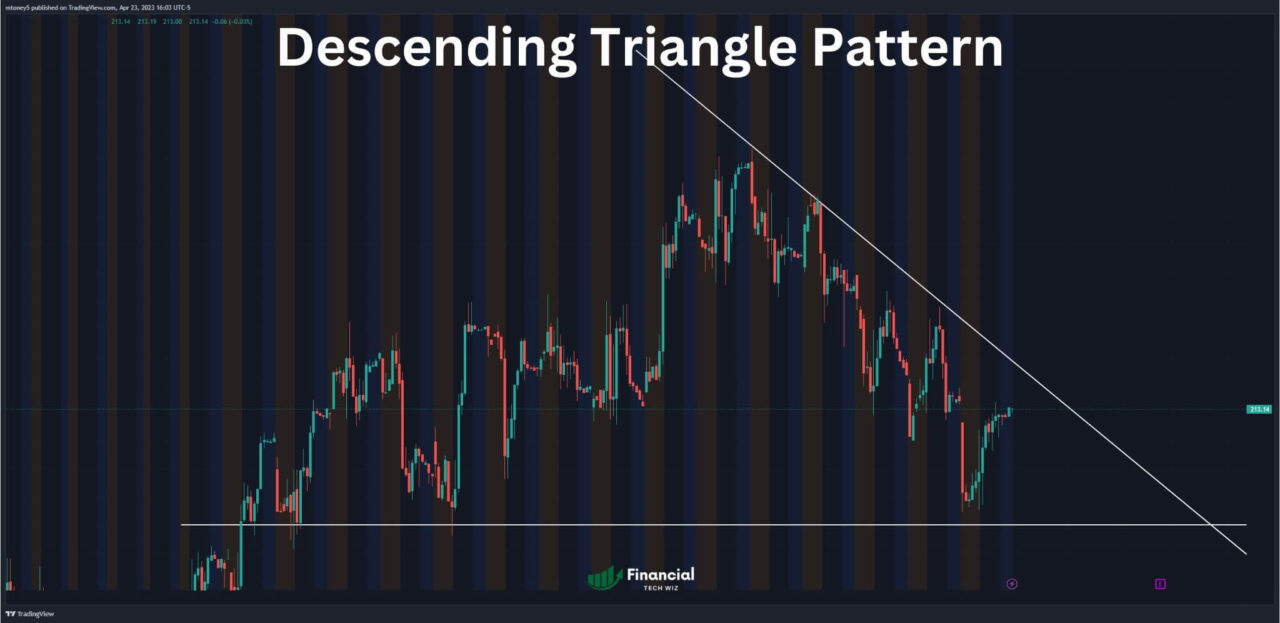
The descending triangle pattern is characterized by:
- A horizontal trend line connecting a series of price lows
- A descending trend line connecting lower highs
This formation signals a potential bearish continuation, often indicating a weakening of buying pressure. The convergence of these two trend lines creates the triangular shape for which the pattern is named.

Key Features and Psychological Implications
Understanding the psychology behind the descending triangle pattern is critical to recognizing its implications. Key features include:
- An established downtrend prior to the pattern’s appearance
- A descending upper trend line indicating increased selling pressure
- A horizontal lower trend line serving as a support level
As the price repeatedly tests the support level without breaking through, traders may become increasingly bearish, leading to a high-volume breakdown below the support.
Is the Descending Triangle Pattern Bullish or Bearish?
The descending triangle pattern is primarily viewed as a bearish continuation pattern, suggesting further declines in price. However, traders should remain alert to the possibility of a bullish reversal. If the price breaks out above the descending trend line, it may signal an uptrend reversal.
Evaluating the Pattern’s Accuracy and Effectiveness
While descending triangles are known for their predictive capabilities, traders should consider the following:
- Percentage of successful breakouts: Confirm the pattern’s reliability through historical data
- Potential false breakouts: Remain cautious of premature entries
- Complementary indicators: Utilize moving averages and volume analysis for signal confirmation
Contrasting Descending and Ascending Triangles
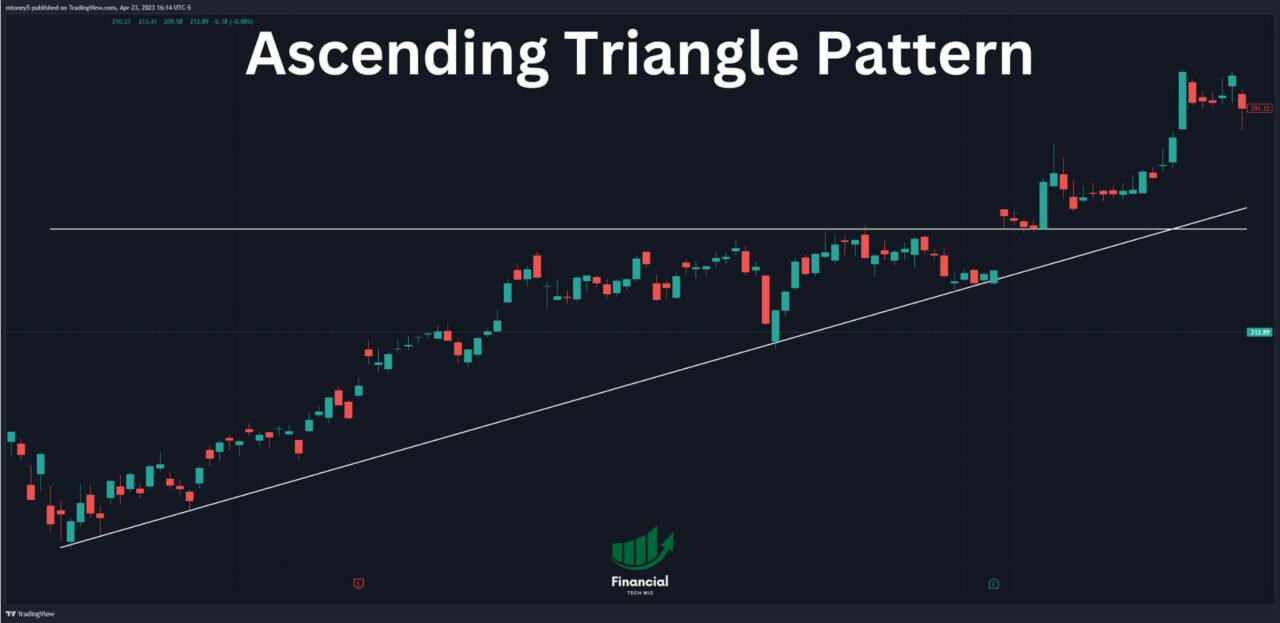
While the descending triangle pattern has a horizontal support and descending resistance, the ascending triangle exhibits a horizontal resistance and ascending support.
Both patterns are continuation patterns, with the ascending triangle typically viewed as bullish.

Strategies for Trading the Descending Triangle
Effectively trading the descending triangle pattern involves:
- Timing entries after a high-volume breakout below support
- Establishing price targets based on the height of the pattern
- Setting stop-loss levels above the descending trend line
For bullish reversal scenarios, consider entering long positions upon a breakout above the descending trend line.
Leveraging the Descending Triangle in Your Trading Toolkit
In summary, the descending triangle pattern is a powerful tool for identifying potential bearish continuations and reversals. By understanding the pattern’s features and psychology, traders can capitalize on profitable opportunities.
As you continue your trading journey, consider exploring additional patterns such as the Cup and Handle, Volatility Contraction Pattern (VCP), and Doji Candle Types for a well-rounded approach.
This article contains affiliate links I may be compensated for if you click them.
– Free trading journal template & cheat sheet PDFs
– Access our custom scanners and watchlists
– Access our free trading course and community!


